- October 15, 2020
- Posted by: Tradingshot Articles
- Category: Cryptocurrency

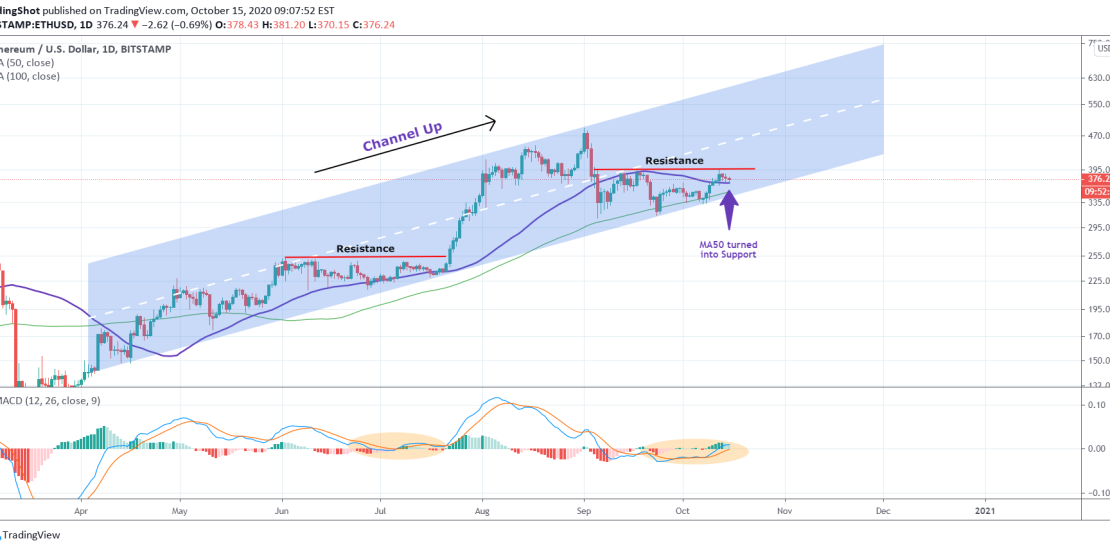
Though this framework is relevant, the most important development of the last days is the $400 Resistance which has been tested (and failed to break) three days ago. This is similar to the June-mid July price action when ETH again struggled to break the (at the time) 255 Resistance, but when it did an aggressive rally started straight to the profit taking zone of the Channel Up.
Notice how in both cases during the later stages of the Resistance testing, the 1D MA50 (blue trend-line) turned into Support. Also the LMACD pattern is similar.
Do you expect a strong rally once this Resistance breaks? Feel free to share your work and let me know in the comments section!
Please like, subscribe and share your ideas and charts with the community!
——————————————————————————————————–
!! Donations via TradingView coins also help me a great deal at posting more free trading content and signals here !!
🎉 👍 Shout-out to TradingShot’s 💰 top TradingView Coin donor 💰 this week ==> AxelShadah
——————————————————————————————————–

