- October 10, 2020
- Posted by: Tradingshot Articles
- Category: Cryptocurrency

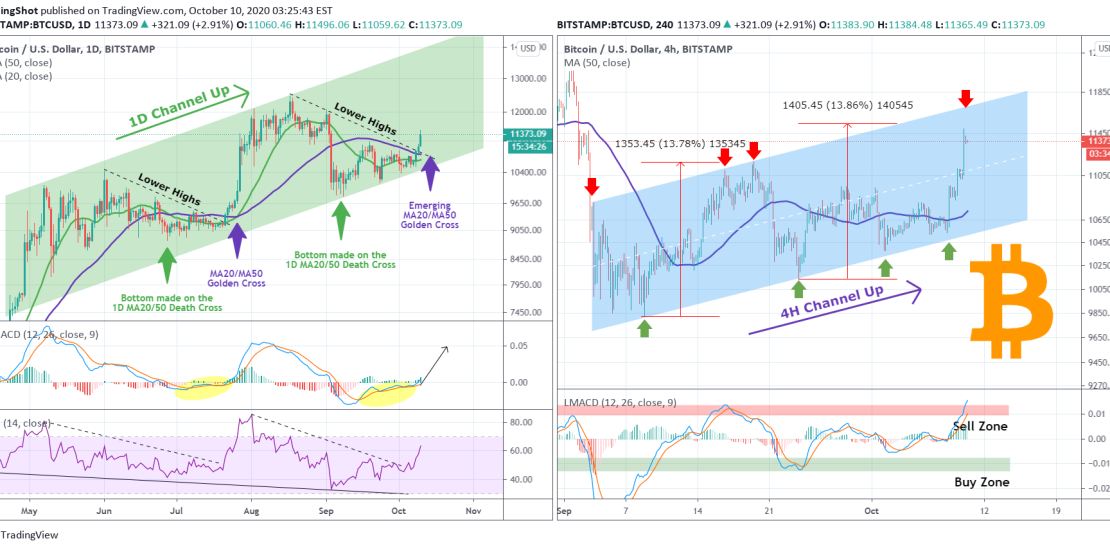
As the title says, the price broke above the MA50 on the 1D chart for thr first time since September 03. By doing so, it touched my first short-term target of $11500 as discussed on the idea below (on September 25th):
And more recently as seen on October 06, as it broke above this Triangle:
** The 1D Channel Up **
The wider (long-term) pattern is see on the left screen and is the (green) Channel Up on the 1D chart. I have analyzed the dynamics of this Channel extensively since May, June, but more recently, I incorporated smaller formations in it, as seen on the idea below:
** The 4H Channel Up **
So all the above suggest that a very important break-out took place for Bitcoin on the long-term. Apart though from the 1D Channel Up, we shouldn’t ignore the more short-term pattern on the right hand-side of the screen, the Channel Up on the 4H chart (blue). This shows that the price has basically completed the symmetrical +13% rise and as it is near the Higher High trend-line, it may deliver a pull-back. We need to see this Higher High trend-line break before adding up on our buy positions.
Apart from that, the confirmation of bullish extension on the 1D chart is the MA20/ MA50 Golden Cross. As seen on the left chart, both the LMACD and the RSI are setting up such a bullish break-out.
Do you think we should wait for the blue 4H Channel Up to break first before buying more, or follow the bullish set-up on 1D (LMACD/ RSI)? Feel free to share your work and let me know in the comments section!
Please like, subscribe and share your ideas and charts with the community!
——————————————————————————————————–
!! Donations via TradingView coins also help me a great deal at posting more free trading content and signals here !!
🎉 👍 Shout-out to TradingShot’s 💰 top TradingView Coin donor 💰 this week ==> TradingView
——————————————————————————————————–
Tradingview link:


