

- June 6, 2020
- Posted by: Tradingshot Articles
- Category: Cryptocurrency
Sounds a bit too cinematic but indeed June is a distinct month for Bitcoin. In the current study I compare 2016 with 2020 and the events that led to the month of June.
** Before we start, please support this idea with your likes and comments, it is the best way to keep it relevant and support me. **
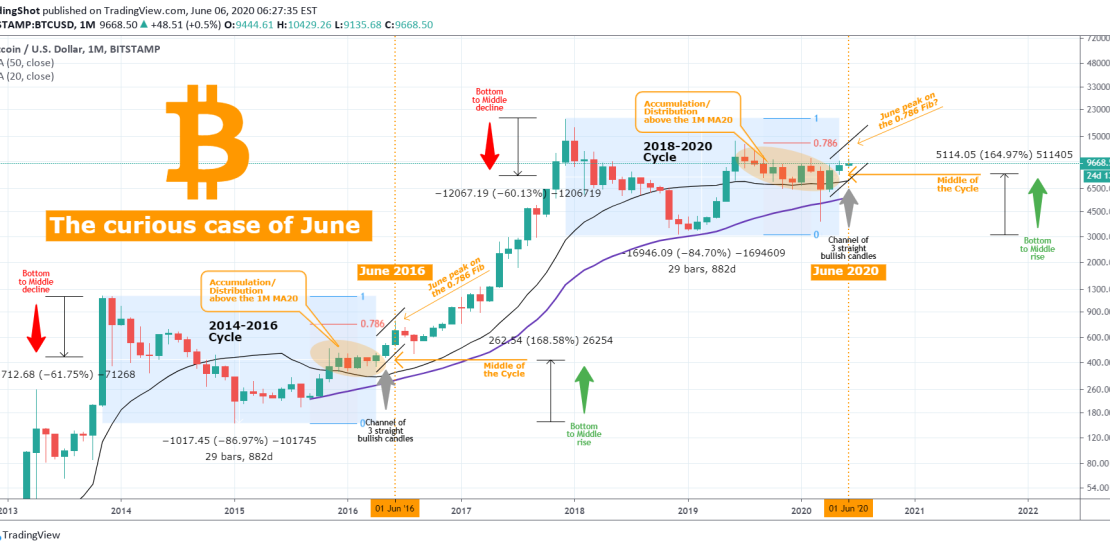
** The 2014-2016 & 2018-2020 Cycles **
First let’s start off by looking at the two cycles in question. Both declined about -85% from their respective tops and made a Cycle Bottom. Once the price broke above the 1M MA20 (black trend-line), Bitcoin entered a new Accumulation/ Distribution Phase. In 2015/2016 this phase has been shorter than 2019/2020 as the current one had the extreme mid 2019 bull run which was early and non-technical (based on hyper euphoric news at the time).
The end of the 2014-2016 Cycle found BTC in the middle of the Cycle, roughly -60% from the Cycle Top and +165% from the Cycle Bottom. Similarly the end of the 2018-2020 Cycle found BTC roughly in the middle of the Cycle, -60% from the Cycle Top and +165% from the Cycle Bottom. This means that despite the euphoria of May/ June 2019 or the collapse of March 2020 (which was fueled by the stock market crash), Bitcoin found a way to end the Cycle and the new Accumulation/ Distribution Phase, in the middle of the Cycle just like it did in 2016. This proves that no matter how much the price diverges from the technical pattern due to outside factors/ news, in the end it always converges back to the pattern.
** The curious case of June **
This brings us back to the significance of June. In 2016 when the Accumulation/ Distribution Phase ended, Bitcoin posted another two strong bullish months, with June in particular peaking around $780 marginally above the 0.786 Fibonacci retracement level from the (then) late 2013 All Time Highs.
Presently (2018-2020) Cycle, BTC came into the month of June (2020) having already two straight bullish months (with April in particular extremely strong), just as it did coming into June 2016. Assuming the same pattern is followed, then BTCUSD could make a June peak around the 0.786 Fibonacci retracement level (from the 2017 All Time Highs), which is now roughly around $13500 (which is close to the ultimate Resistance of the $13800 June 2019 top). The case can be made even stronger if we assume that the count of tree straight bullish monthly candles starts at the end of the Cycles, meaning that June is the second straight and July could be bullish too.
This of course may come into contrast with some of the shorter time-frame (1D) analyses, which (justifiably) indicate that the $10500 9-month Resistance has to break first to consider a bullish extension. But nonetheless it is a good and reliable benchmark on the longest possible time-frame (the monthly 1M).
So what do you think? Do you believe that June can peak around the 0.786 Fibonacci at $13500? Or this is (arguably) a little too high too soon? Feel free to share your work and let me know in the comments section!
Please like, subscribe and share your ideas and charts with the community!
Tradingview link:
https://www.tradingview.com/chart/BTCUSD/fL26XTpm-BITCOIN-The-curious-case-of-June