

- May 19, 2020
- Posted by: Tradingshot Articles
- Category: Cryptocurrency
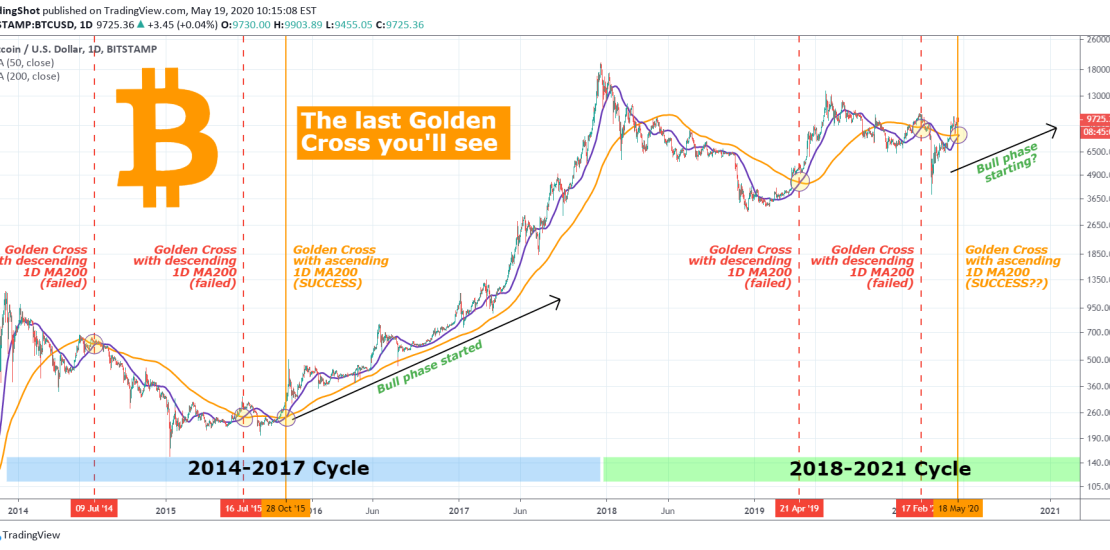
We can all see that Bitcoin is consolidating just below the $10000 mark these past few days. What some may not see is that if it continues this way for another 1-2 days, a Golden Cross will be printed on the 1D chart (for those not familiar it is when the MA50 crosses above the MA200). Before some rush out to tell me that we already had one 1D Golden Cross in mid-February 2020 which failed miserably and that Golden Crosses do not necessarily translate to uptrends, allow me to explain why this one may be different and kickstart the Bull Phase of the current BTC Cycle.
** Before we start, please support this idea with your likes and comments, it is the best way to keep it relevant and support me. **
So far the current BTC Cycle (2018-onwards) has had two 1D Golden Crosses: one on April 21st 2019 and the second on February 17th 2020. The 1st Golden Cross took BTC off of its 3200 Cycle Bottom and gave way to a strong bullish sequence to 13800, which failed to sustain the momentum and dropped to 6500. The 2nd was made around the time BTC was testing the 10500 Resistance (the one we try to break now as well) and also failed, dropping to 3900. The emerging one will be the third of this Cycle. But why could this one succeed where the previous two failed?
** The Golden Crosses of the 2014-2017 Cycle **
The answer lies on Bitcoin’s previous (2014-2017) Cycle. During that period, we also had three 1D Golden Crosses taken place. The first one quite early (in the Bear Market before the Bottom was in) on July 9th 2014, which failed. The second after the Bottom on July 16th 2015, which was made on a local top and failed too. And the third was on October 28th 2015, which gave way to a strong spike to 500 and the subsequent pull back to 300 was never seen again and we started making Higher Lows on the long-term. This was what essentially initiated the Bull Phase and was literally the last Golden Cross of the Cycle.
** The important of the 3rd Golden Cross **
But why did the 3rd Golden Cross during the previous Cycle succeeded while the first two failed? The obvious answer lies on the trend of the MA200. In the first 2 Golden Crosses, the MA50 crossed above the MA200, while the MA200 was descending. This may be the reason why they failed. But on the 3rd Golden Cross, the MA50 crossed above the MA200, while the MA200 was ascending. And this may be why it succeeded and kickstarted the Bull Phase.
** Conclusion **
Right now on the current Cycle, all the parameters are set in the exact spot they were on the October 2015 (3rd) Golden Cross. As you see the 1D MA50 is again just about to cross above the MA200 while the MA200 is (marginally though but it is) ascending, in contract to the previous two Golden Crosses of the Cycle.
So what do you think? Can history repeat and make this (3rd) 1D Golden Cross the last we will see in this Cycle and initiate the long term bull run? And if so should we be expecting again an initial spike and then a pull back to the the 1D MA50? Feel free to share your work and let me know in the comments section!
Please like, subscribe and share your ideas and charts with the community!
Tradingview link: