

- May 17, 2020
- Posted by: Tradingshot Articles
- Category: Cryptocurrency
How does $13000 sound as Bitcoin’s next target? Given the quick and strong nature of the late March/ April recover, this is not such an unrealistic number, especially considering that we are now past the Halving event, which is historically extremely bullish for BTC on the long-term.
** Before we start, please support this idea with your likes and comments, it is the best way to keep it relevant and support me. **
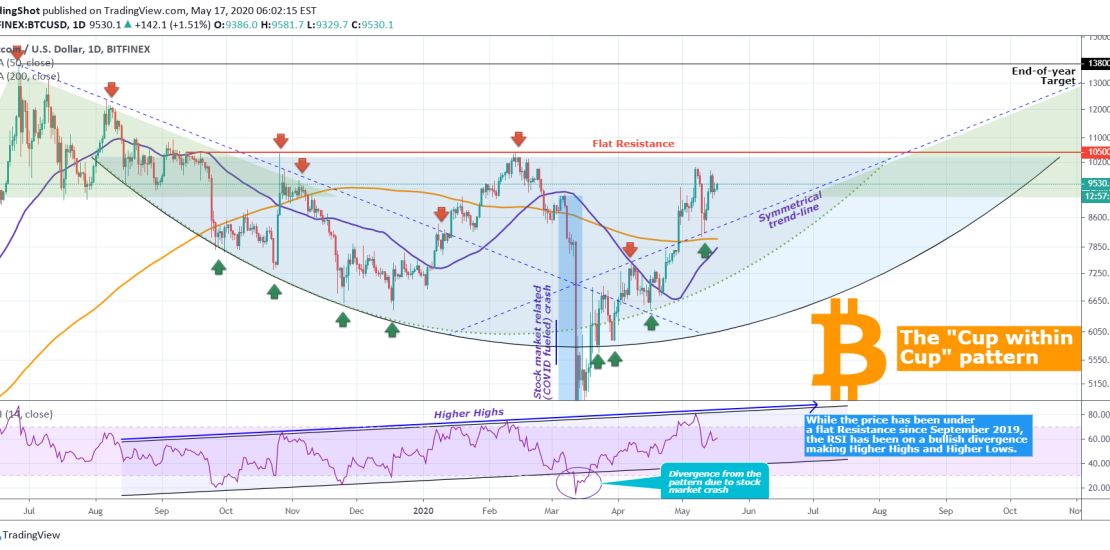
** The Resistance and the bullish RSI **
However this new target doesn’t come without terms, there are very certain trend-lines we need to pay attention to such as the 10500 Resistance. This level has been holding since early September 2019 and has already rejected break-out attempts twice (October 26 2019 and February 13 2020). It is therefore no surprise that BTC has been struggling around the 10000 mark for two weeks now.
While this 10500 flat Resistance has been holding for that long, at the same time the RSI has been showing strength, being under a bullish divergence on Higher Highs and Higher Lows. That is of course excluding the collapse of early March which was non-technical, fueled by the stock market crash. This bullish RSI is an underlying bullish signal that should ultimately result in breaking the 10500 Resistance.
** The “Cup within Cup” pattern **
This price and RSI divergence has resulted in forming a Cup pattern with the RSI’s Higher Lows being Lower Lows on the price curve. As mentioned above the (non-technical) early March (stock related) crash was the only time that curve broke as in the occasion on the RSI. At the moment this Cup formation (black line) doesn’t show a possibility of breaking lower than 7000 – 6500.
On top of that, we can identify a narrower Cup formation within the Cup we just analyzed, which shows an even tighter support. This smaller “Cup within Cup” is displayed by the dotted orange curve.
Note that there is also the (dashed blue) trend-line to be mindful of, which is symmetrical to the one that started after the June 26 2019 peak at 13800.
** Conclusion **
All the above parameters show that BTCUSD is well supported on the long-term on a “Cup within Cup pattern” which is forming the right side of the formation. This is likely to charge the break-out above $10500, which will give way to the $13800 annual high of 2019. This process requires our patience and careful buying of potential pull-backs towards the curves or adding on the Resistance break-out. Investing on Bitcoin is a marathon not a sprint and as long as we keep that in mind we will again end up with at least 10X our investment at the end of the current Cycle.
So what do you think? Do you believe that these Cup formations will support BTC until the 10500 Resistance breaks? Or have an alternative scenario to present? Feel free to share your work and let me know in the comments section!
Please like, subscribe and share your ideas and charts with the community!
Tradingview link: