

2019
-
ETCUSD Time to test the Resistance
- March 5, 2019
- Posted by: Tradingshot Articles
- Category: Uncategorized
No Comments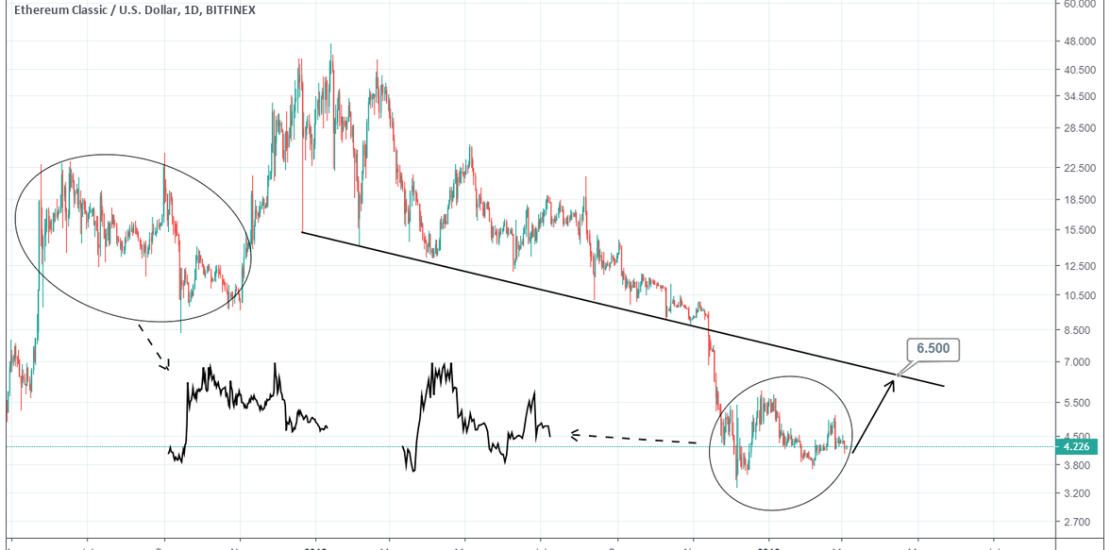
Pattern: Bullish fractal. Signal: Bullish. Target: 6.500 (test of the Resistance trend line). Tradingview link: https://www.tradingview.com/chart/ETCUSD/pAHfetSY-ETCUSD-Time-to-test-the-Resistance/
-
BITCOIN The bottom is in. Would you miss this chance in 2015?
- March 5, 2019
- Posted by: Tradingshot Articles
- Category: Cryptocurrency
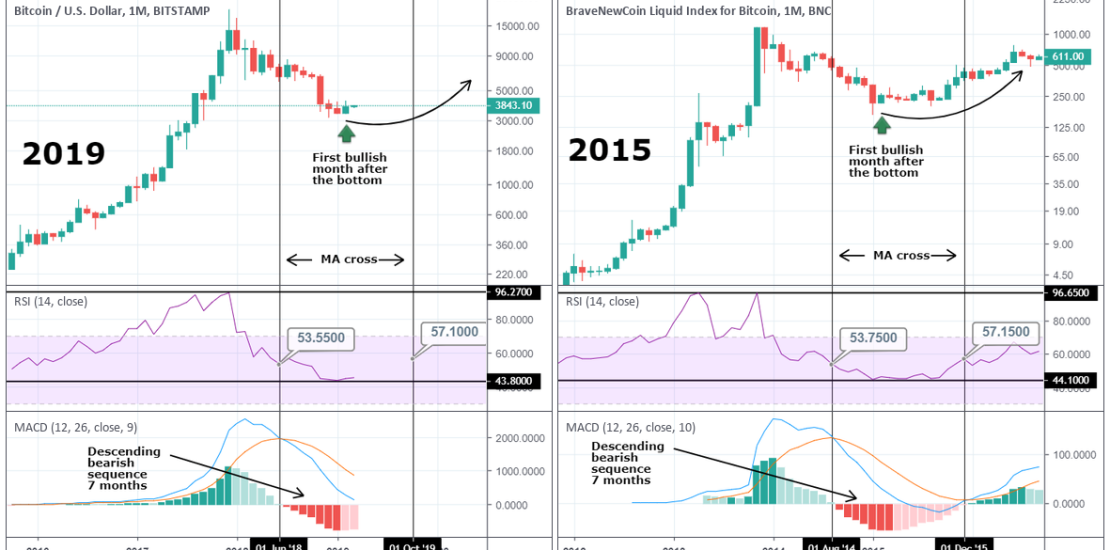
Similarities of now (2019) and then (2015) showing that the bottom is already in and after some months of consolidation we will start seeing higher and higher prices. * RSI 2019: the RSI peaked at 96.2700 on the ATH then dropped to 43.800, near the level it is currently consolidating. The bearish MA cross took place with
-
XAUUSD Buy Signal
- March 4, 2019
- Posted by: Tradingshot Articles
- Category: Uncategorized
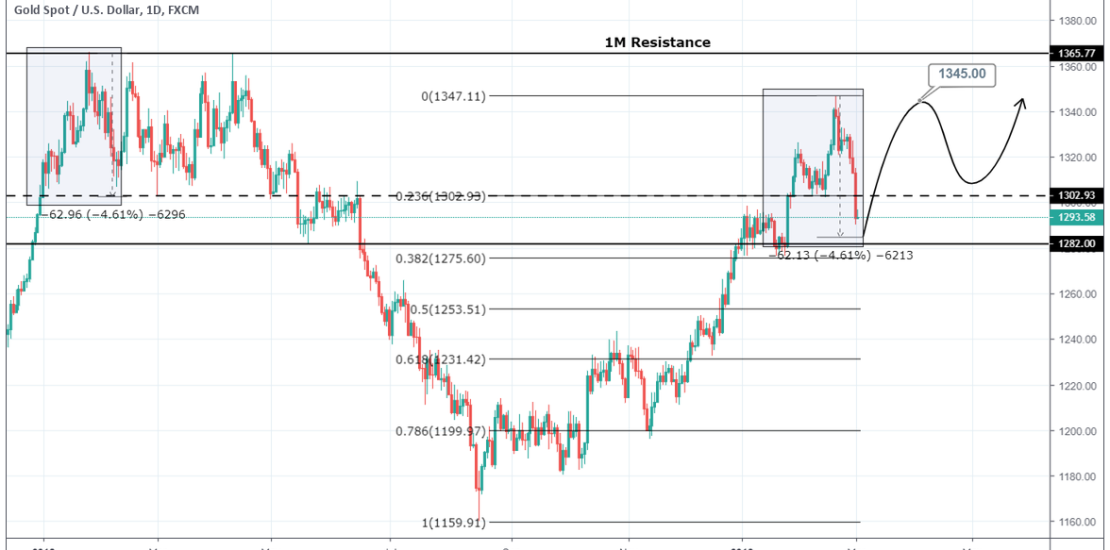
Pattern: Fibonacci retracement to 0.382. Signal: Bullish as a similar fractal points to a bounce on a -4.61% pull back from the top. Target: 1345 (the previous top). Tradingview link: https://www.tradingview.com/chart/XAUUSD/pTnStnkR-XAUUSD-Buy-Signal/
-
USDJPY Sell Signal
- March 4, 2019
- Posted by: Tradingshot Articles
- Category: Uncategorized
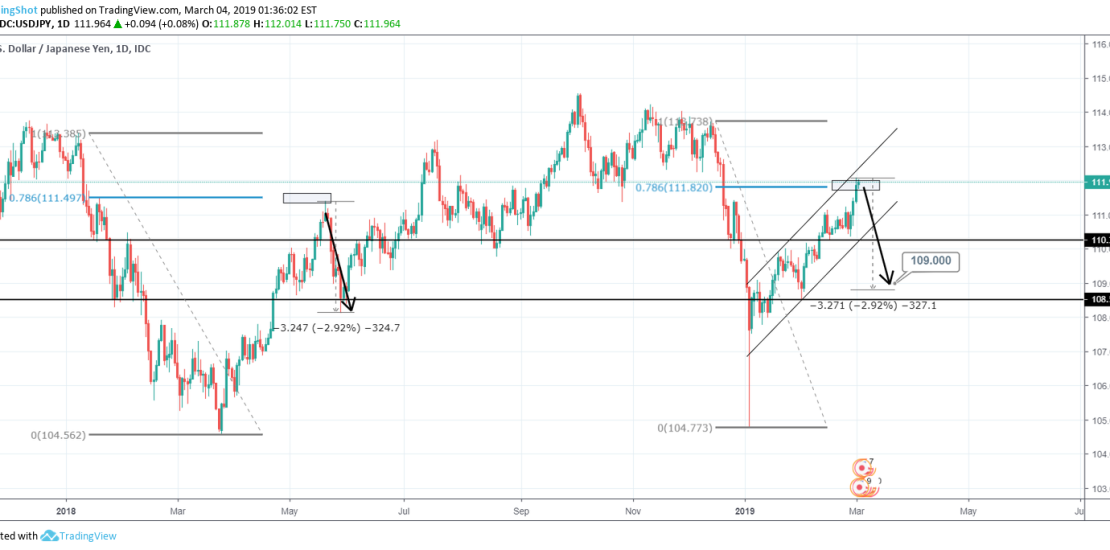
Pattern: Fibonacci retracement to 0.786. Signal: Bearish after identifying a similar fractal on the previous 1W Resistance/ Support levels. Target: 109.000 (just above a -2.92% pull back). Tradingview link: https://www.tradingview.com/chart/USDJPY/8hvy6zu8-USDJPY-Sell-Signal/
-
GBPUSD Sell Signal
- March 4, 2019
- Posted by: Tradingshot Articles
- Category: Uncategorized
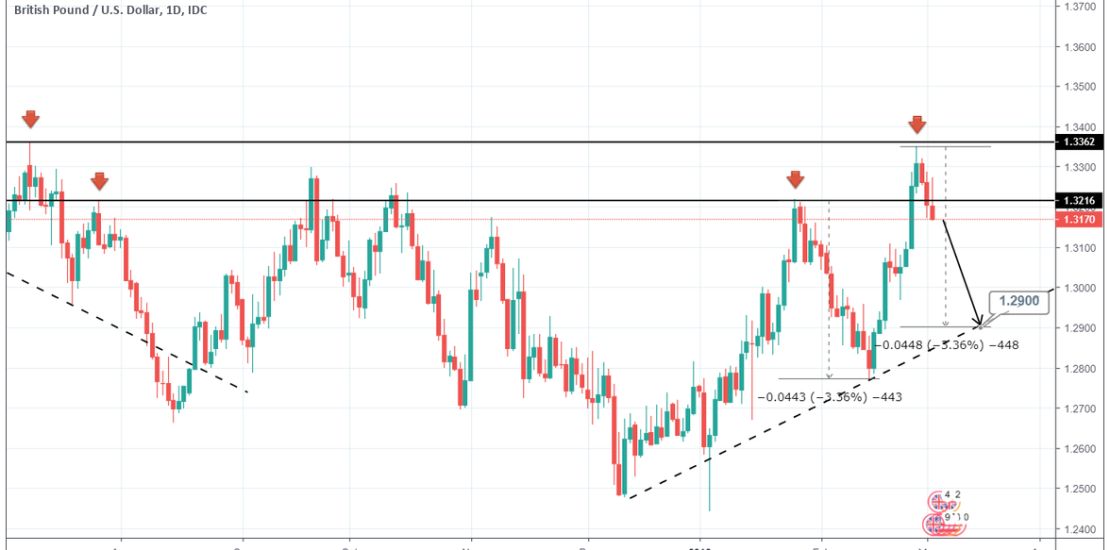
Pattern: Ascending Megaphone on 1D. Signal: Bearish after the price was rejected on the 1W Resistance. Target: 1.2900 (-3.36% pull back based on previous Higher Low). Tradingview link: https://www.tradingview.com/chart/GBPUSD/V5WELccR-GBPUSD-Sell-Signal/
-
NEOUSD Change of trend. TP 13.50.
- March 3, 2019
- Posted by: Tradingshot Articles
- Category: Uncategorized
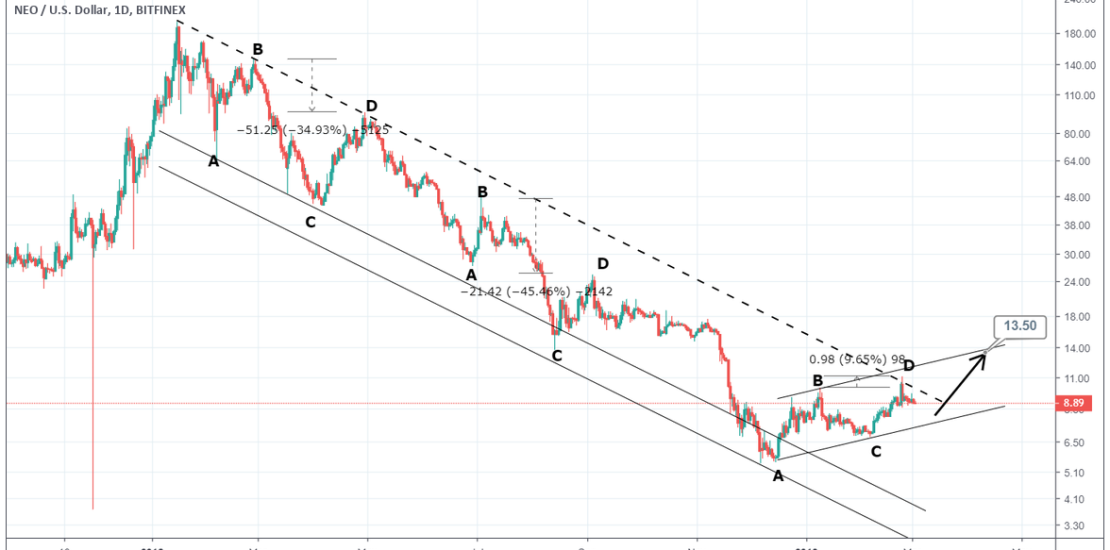
Pattern: Channel Up on 1D. Signal: Bullish after shift on ABCD pattern and break of the 1M Channel Down. Target: 13.50. Tradingview link: https://www.tradingview.com/chart/NEOUSD/5qSrdri7-NEOUSD-Change-of-trend-TP-13-50/
-
RVNUSD Buy Signal. Channel Break-Out.
- March 3, 2019
- Posted by: Tradingshot Articles
- Category: Uncategorized
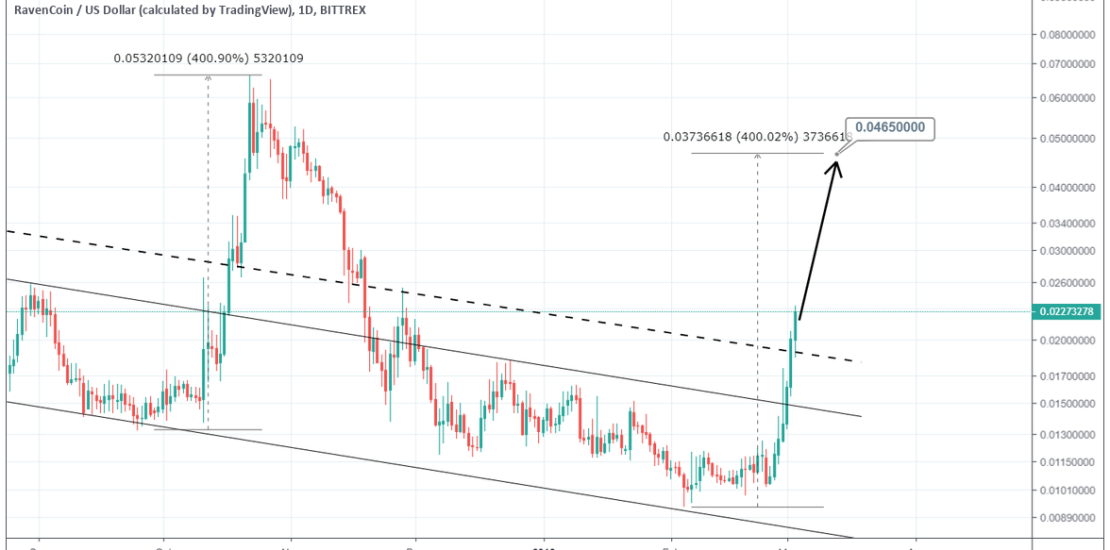
Pattern: Descending H&S. Signal: Bullish. Target: 0.465000. Tradingview link: https://www.tradingview.com/chart/RVNUSD/Wz1Yhslv-RVNUSD-Buy-Signal-Channel-Break-Out/
-
LTCUSD Buy Signal
- March 3, 2019
- Posted by: Tradingshot Articles
- Category: Uncategorized
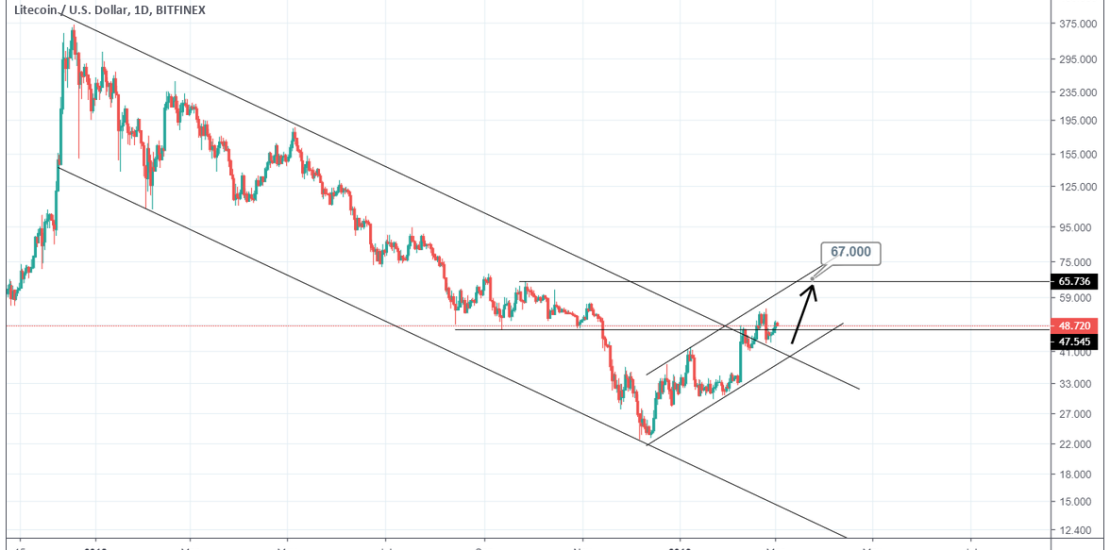
Pattern: Channel Up on 1D. Signal: Bullish after the 1M Channel Down broke to the upside. Target: 67.000 (the next level of resistance). Tradingview link: https://www.tradingview.com/chart/LTCUSD/X8QRvtSK-LTCUSD-Buy-Signal/
-
BATUSD Buy Signal – 50% profit opportunity
- March 3, 2019
- Posted by: Tradingshot Articles
- Category: Uncategorized
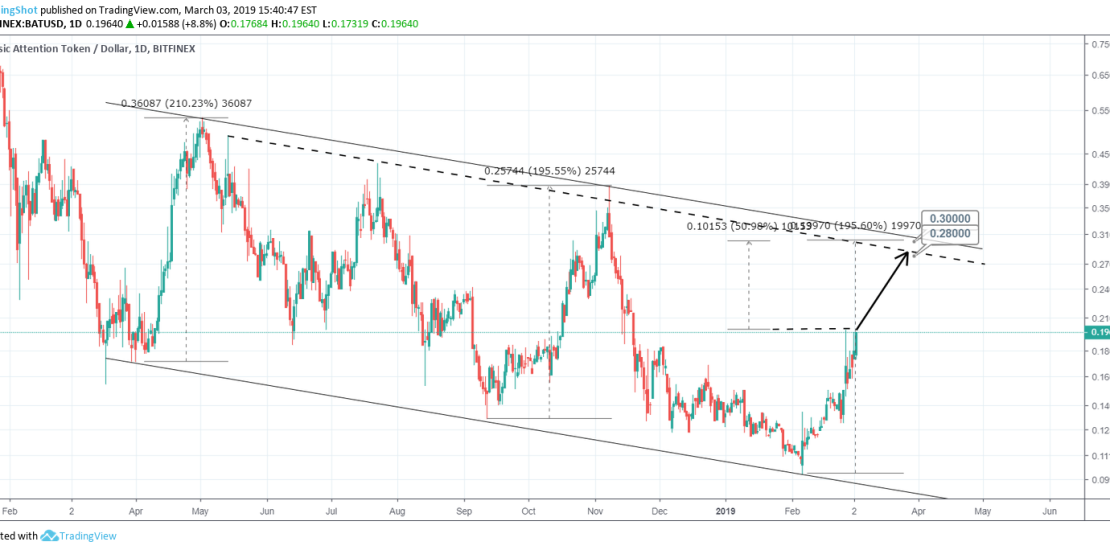
Pattern: Channel Down on 1D. Signal: Bullish towards a Lower High. Target: 0.2800 – 0.30000. Tradingview link: https://www.tradingview.com/chart/BATUSD/rxdoOwAM-BATUSD-Buy-Signal-50-profit-opportunity/
-
USDNOK Strong long term Buy Signal
- March 1, 2019
- Posted by: Tradingshot Articles
- Category: Uncategorized
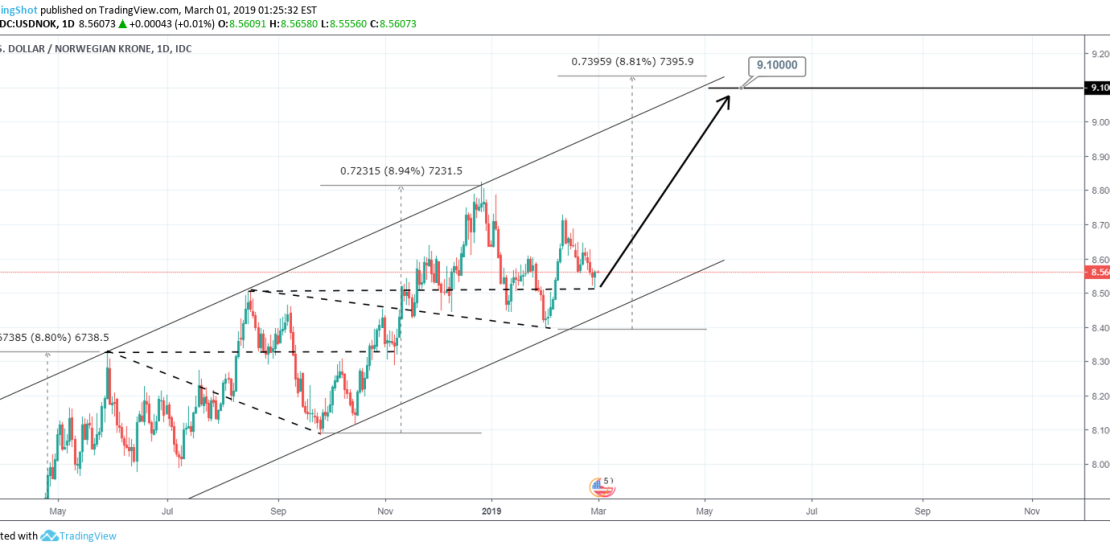
Pattern: Channel Up on 1W. Signal: Bullish after since pattern made a Higher Low. Target: 9.1000 (just below the +8.80% extension). Tradingview link: https://www.tradingview.com/chart/USDNOK/W4e71F1N-USDNOK-Strong-long-term-Buy-Signal/