2019 September
-
BITCOIN A fractal you cannot ignore! Can this show the bottom?
- September 27, 2019
- Posted by: Tradingshot Articles
- Category: Cryptocurrency
No Comments
This is just a quick analysis of what this week’s strong rejection can mean for BTC if indeed we are repeating the main fractal of the 2018 bear market. First of all I am not a fan of this formation as we are comparing two periods under largely different parameters. The first was a
-
EURUSD Buy Signal
- September 25, 2019
- Posted by: Tradingshot Articles
- Category: Uncategorized
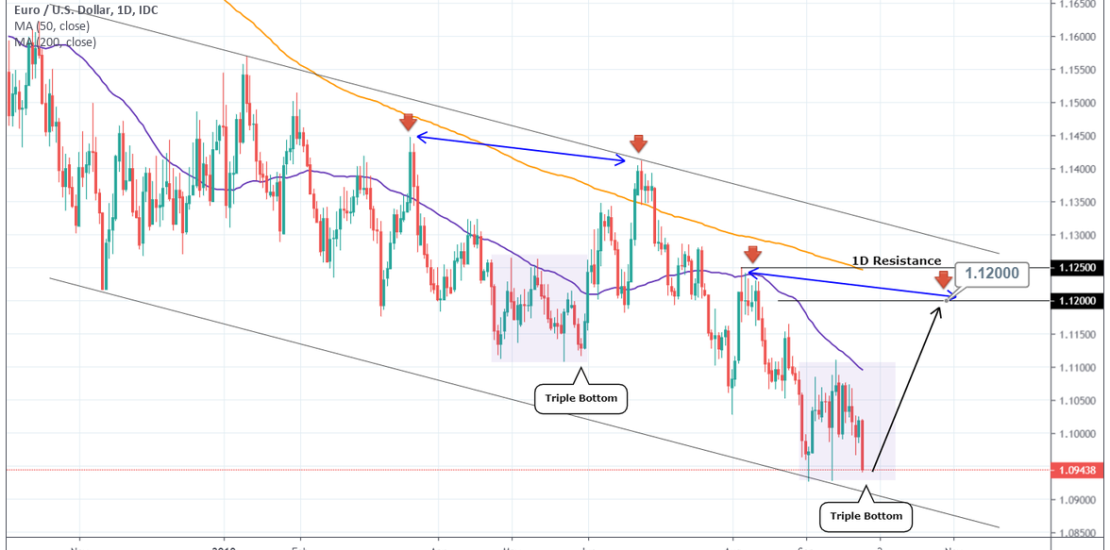
Pattern: 1W Channel Down. Signal: Bullish due to A) the Lower Low of the Channel Down and B) almost Triple Bottom as the April – May cohesion. Target: 1.12000 (symmetrical point within the 1D Resistance Zone). Tradingview link: https://www.tradingview.com/chart/EURUSD/tABCNe61-EURUSD-Buy-Signal
-
BITCOIN Will the $6000 gap be filled before the Halving?
- September 22, 2019
- Posted by: Tradingshot Articles
- Category: Cryptocurrency
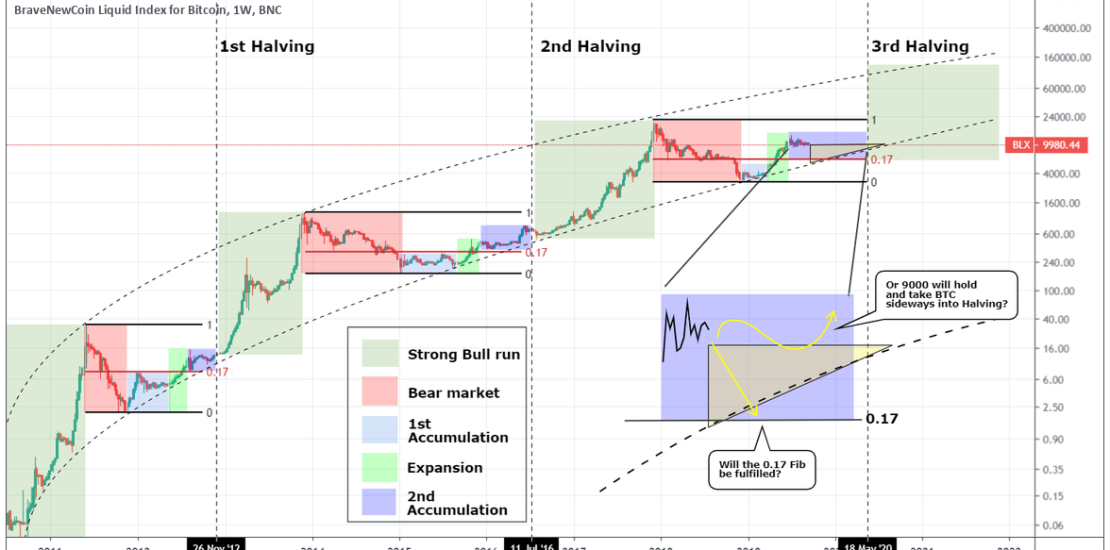
As the new Bull Market progresses, Bitcoin has left few questions unanswered. One of those has to do with its historic tendency to touch the 0.17 Fibonacci retracement level before the Halving during its 2nd accumulation phase. But let’s take this from the beginning. Each BTC cycle is divided into 5 phases: * After each
-
BITCOIN Is this consolidation a sign of an upcoming ALT SEASON?
- September 20, 2019
- Posted by: Tradingshot Articles
- Category: Cryptocurrency
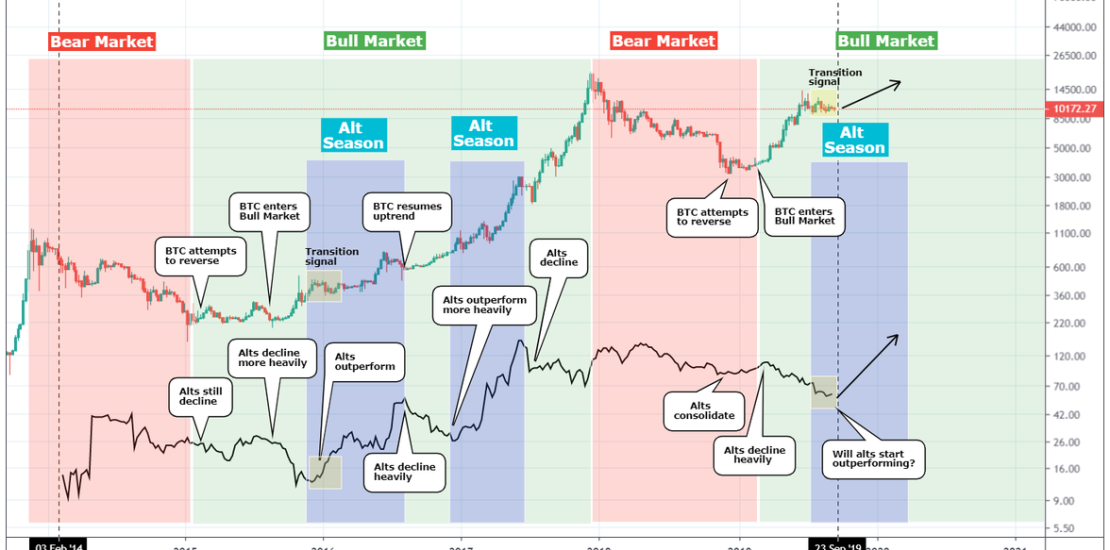
Bitcoin has been consolidating since the June 26th annual High. This is not news. What is interesting though is how this price action on BTC can be related to the rest of the market. During the previous Bull Market (2015 – 2017), Bitcoin and the Alts have had clear balance of power shifts. When Bitcoin
-
GBPJPY Lower Buy Signal
- September 19, 2019
- Posted by: Tradingshot Articles
- Category: Uncategorized
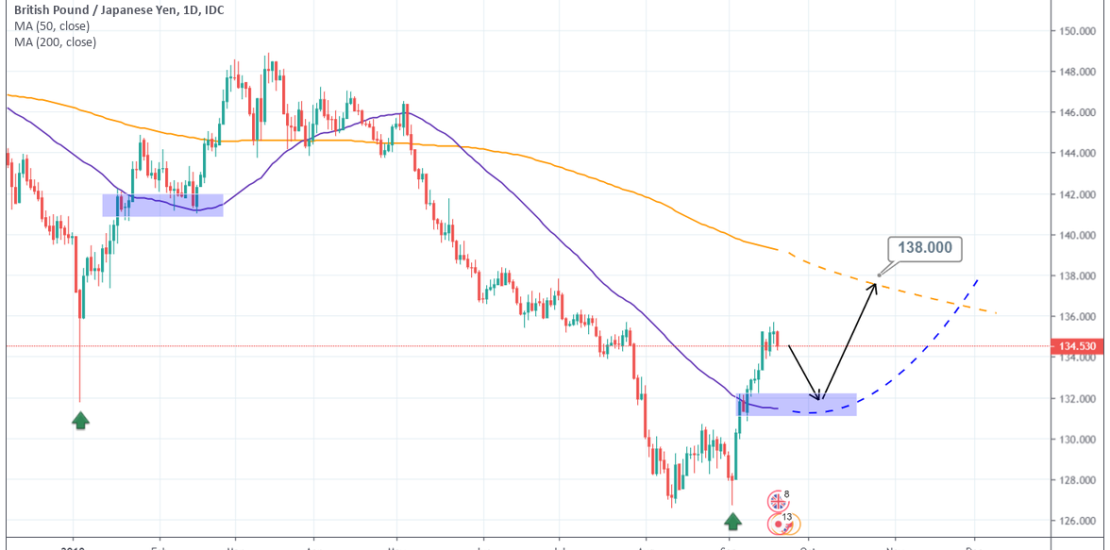
Pattern: 4H Channel Up. Signal: Bullish once a pull back takes place towards the 1D MA50 in the same fashion as Jan/ Feb 2019. Target: 138.000 (expected contact with the 1D MA200). Tradingview link: https://www.tradingview.com/chart/GBPJPY/Lcrq45u0-GBPJPY-Lower-Buy-Signal
-
USDPLN Buy Signal
- September 19, 2019
- Posted by: Tradingshot Articles
- Category: Uncategorized
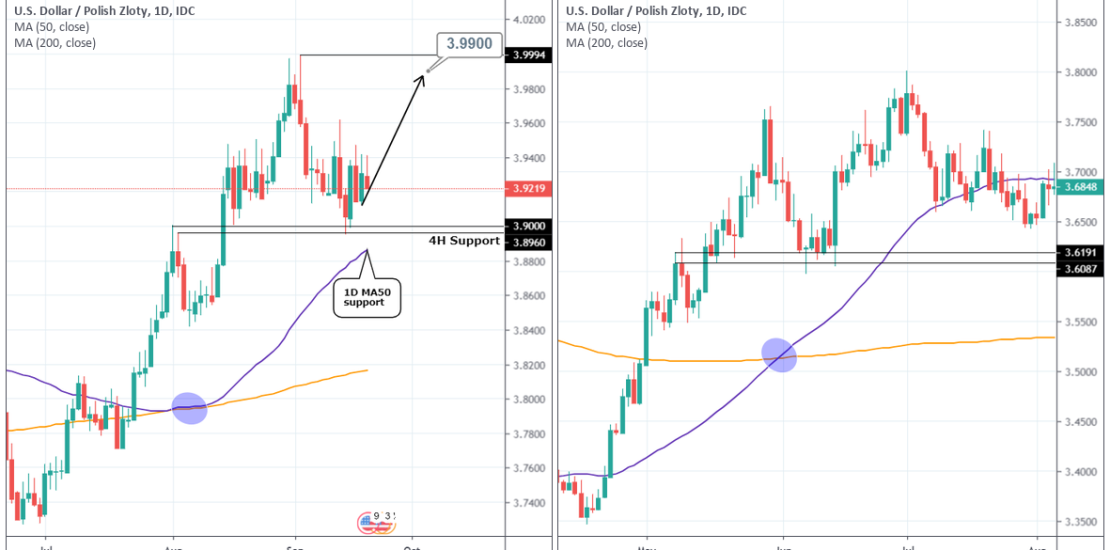
Pattern: Head and Shoulders on 1D. Signal: Bullish as the Right Shoulder formation bounced on the 4H Support. Target: 4.9900 (just below the Resistance). Tradingview link: https://www.tradingview.com/chart/USDPLN/g7lUlW28-USDPLN-Buy-Signal
-
NOKSEK 09/16/2019
- September 16, 2019
- Posted by: Tradingshot Articles
- Category: Uncategorized
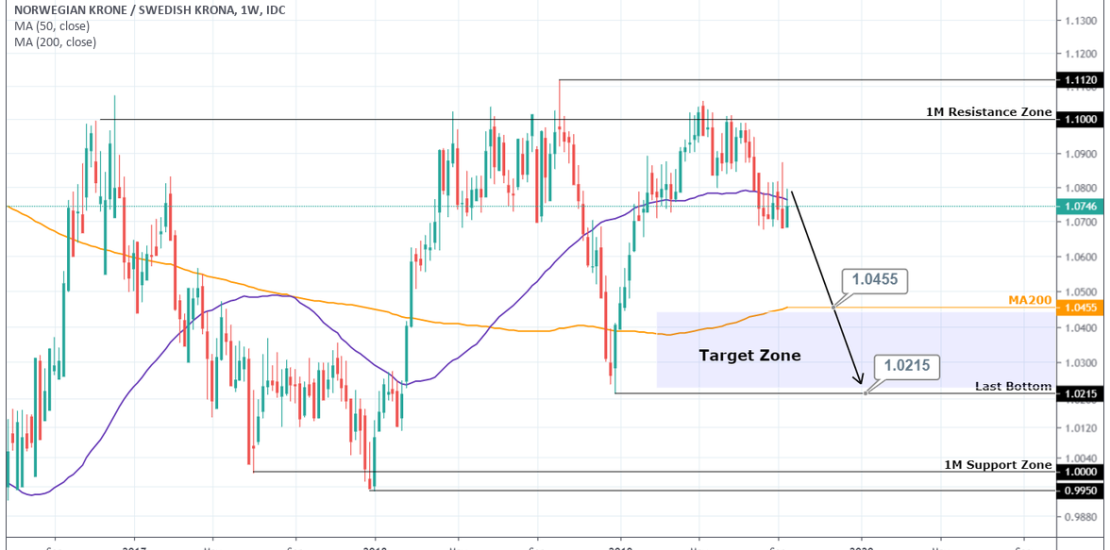
Pattern: Rectangle on 1M. Signal: Bearish as the price was rejected on the 1M Resistance Zone. Target: 1.0455 and 1.0215 in extension. Tradingview link: https://www.tradingview.com/chart/NOKSEK/iKhAzXMV-NOKSEK-09-16-2019
-
LITECOIN Found support on 1W MA50. Will history repeat itself?
- September 13, 2019
- Posted by: Tradingshot Articles
- Category: Uncategorized
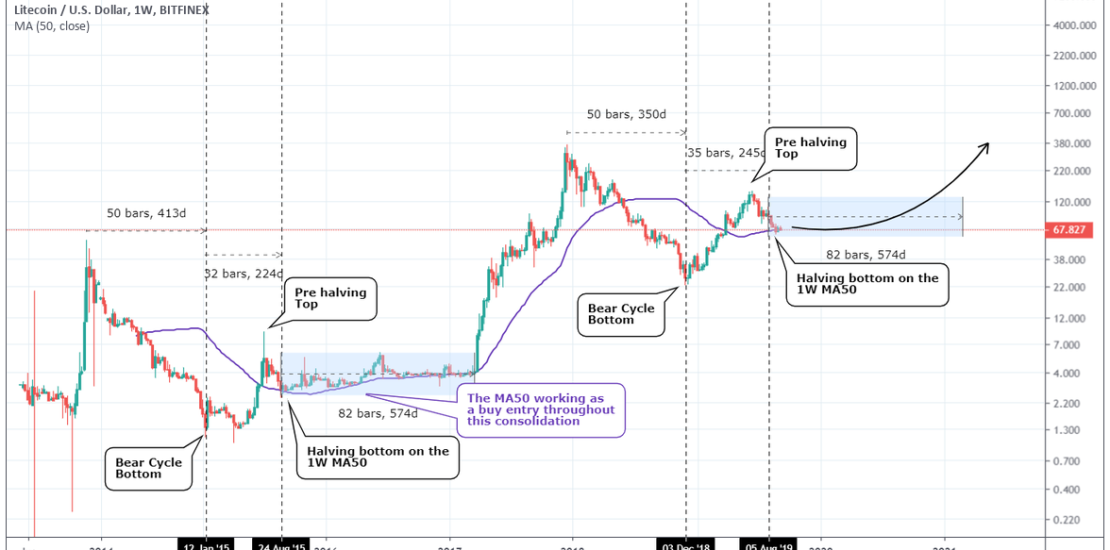
The title really says it all. LTC is trading around the 1W MA50 on a possible mid term support event for the current Bull Cycle, which is methodically repeating the 2015 sequence. This MA period previously held throughout 2015 – early 2017 up until Litecoin initiated its super strong rise to the mid $300s peak.
-
ETHEREUM following BITCOIN’s first cycle?
- September 9, 2019
- Posted by: Tradingshot Articles
- Category: Cryptocurrency
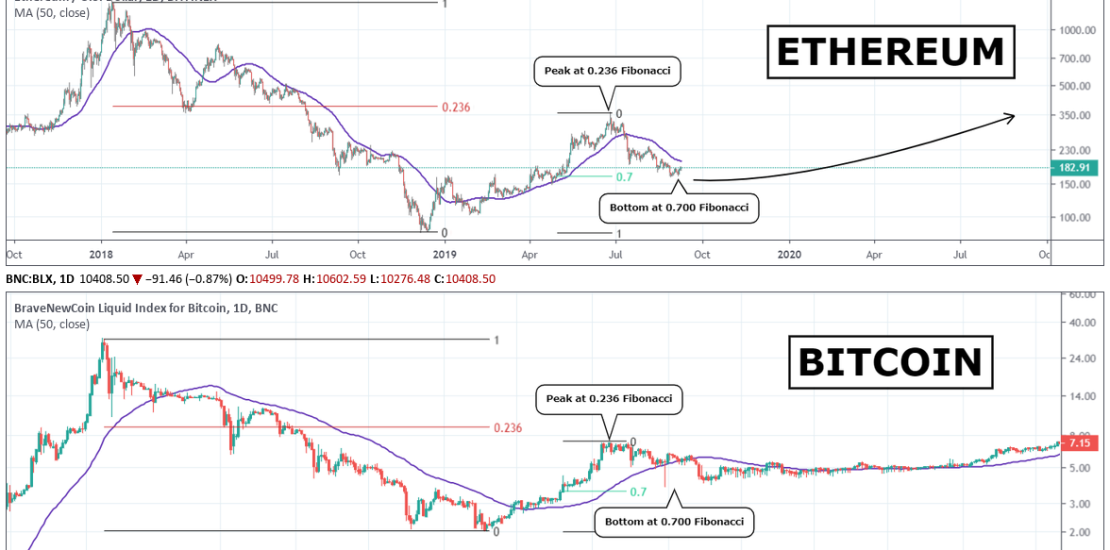
Well the title says it all, but can it really be? Ethereum currently following Bitcoin’s first cycle (2011/ 2012)? This is a simplistic yet interesting comparison of the two cycles. After BTC’s 2011 bottom, the price peaked near the 0.236 Fibonacci retracement. Then it pulled back again but found support on the 0.700 Fibonacci retracement
-
USDDKK Buy Signal
- September 6, 2019
- Posted by: Tradingshot Articles
- Category: Forex
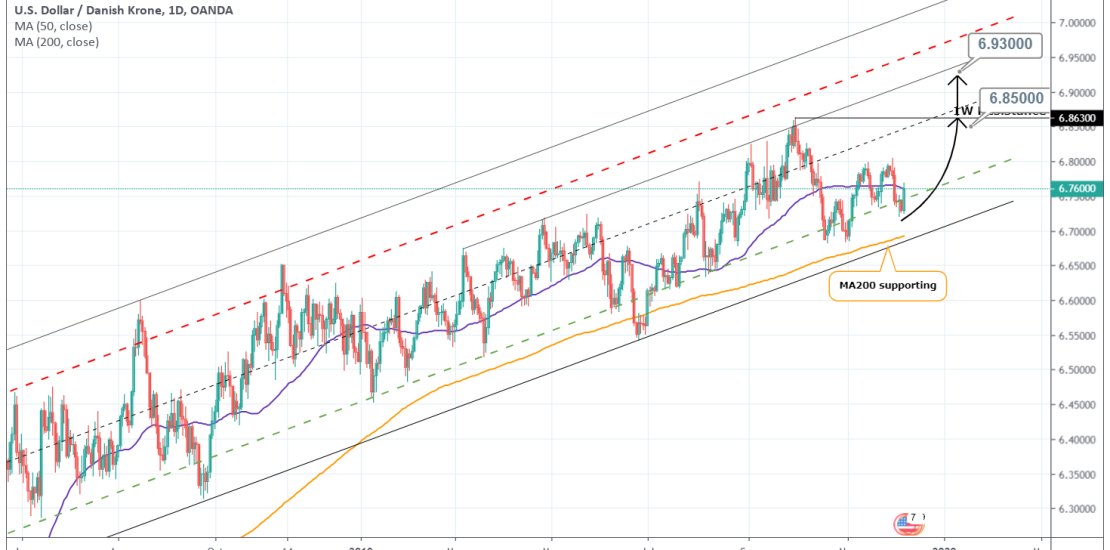
Pattern: Channel Up on 1M. Signal: Bullish as the price is on the Higher Low zone of the Channel Up, supported by the 1D MA200. Target: 6.8500 (just below the 1W Resistance) and if the 1W R breaks 6.9300 (projected Higher High). Tradingview link: https://www.tradingview.com/chart/USDDKK/GcyQ9q2O-USDDKK-Buy-Signal
- 1
- 2

