

2019 March
-
DAX Big Sell Signal
- March 15, 2019
- Posted by: Tradingshot Articles
- Category: Uncategorized
No Comments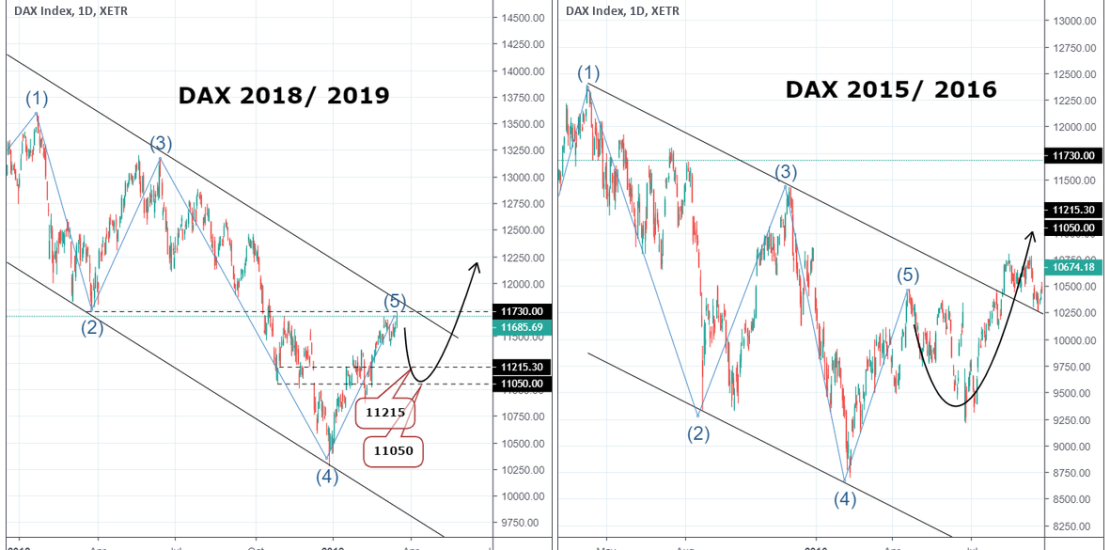
Pattern: Channel Down on 1W. Signal: Bearish since the price is near the pattern’s Lower High. Target: TP1 11215, TP2 11050. *Note: The same pattern took place in 2015/ 2016. After the 5th wave on the Lower High the index pulled back to its 0.5 Fibonacci and then broke the Channel upwards. Tradingview link: https://www.tradingview.com/chart/DAX/CQbswQgi-DAX-Big-Sell-Signal/
-
Bitcoin’s Fibonacci Channel and the Band Shift to 100k
- March 11, 2019
- Posted by: Tradingshot Articles
- Category: Cryptocurrency
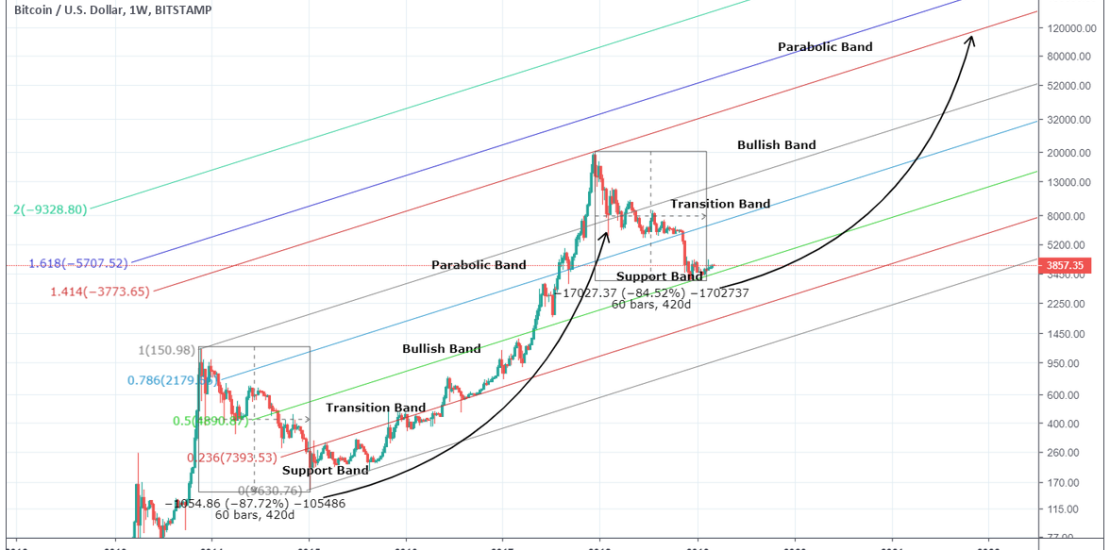
BTC’s last bull market can be adequately broken down using the Fibonacci Channel as a Phase Marker. During 2015 the 0 – 0.236 Fibonacci band was used as a Support. Similarly in 2016 the 0.236 – 0.5 was the Transition Phase from the Bottom to the start of the new Bull Market, leading to then
-
MANAUSD Buy Signal
- March 8, 2019
- Posted by: Tradingshot Articles
- Category: Uncategorized
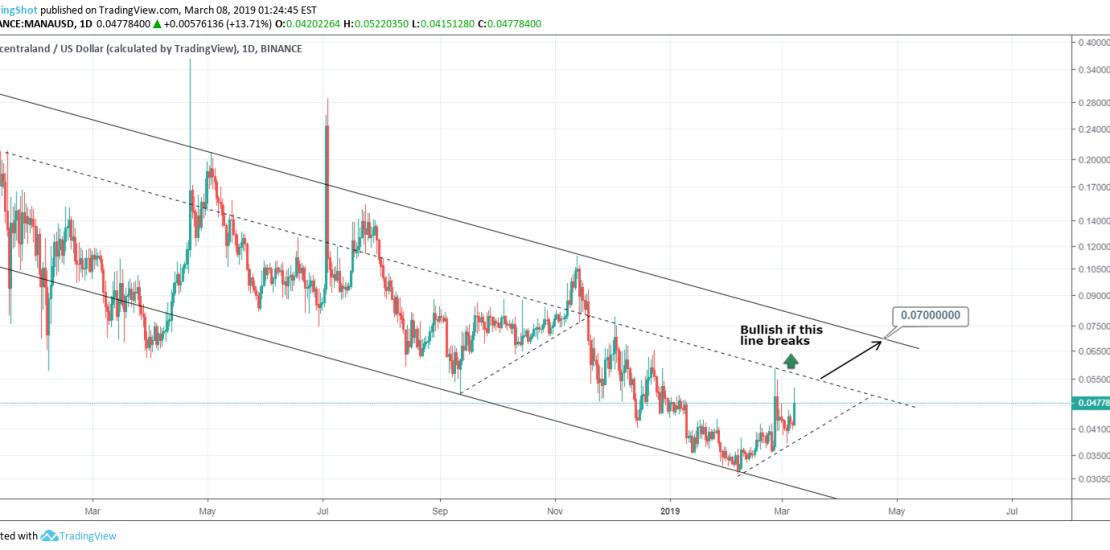
Pattern: Channel Down on 1W. Signals: Bullish if the inner Lower High line breaks. Target: 0.07000 (outer Lower High). Tradingview link: https://www.tradingview.com/chart/MANAUSD/Q3yWH21C-MANAUSD-Buy-Signal/
-
DOLLAR INDEX Sell Signals
- March 7, 2019
- Posted by: Tradingshot Articles
- Category: Uncategorized
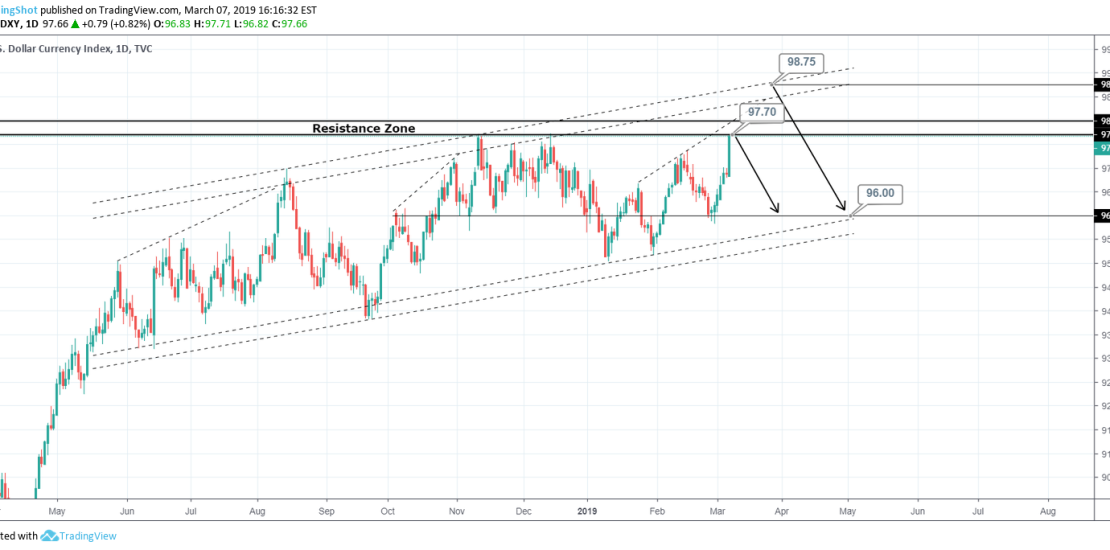
Pattern: Channel Up on 1W. Signal: Bearish on two marks. 1st the 97.70 Resistance. 2nd the 98.75 estimated Higher High. Target: 96.00. Tradingview link: https://www.tradingview.com/chart/DXY/Kk5Liaq5-DOLLAR-INDEX-Sell-Signals/
-
DAX Sell Signal
- March 6, 2019
- Posted by: Tradingshot Articles
- Category: Uncategorized
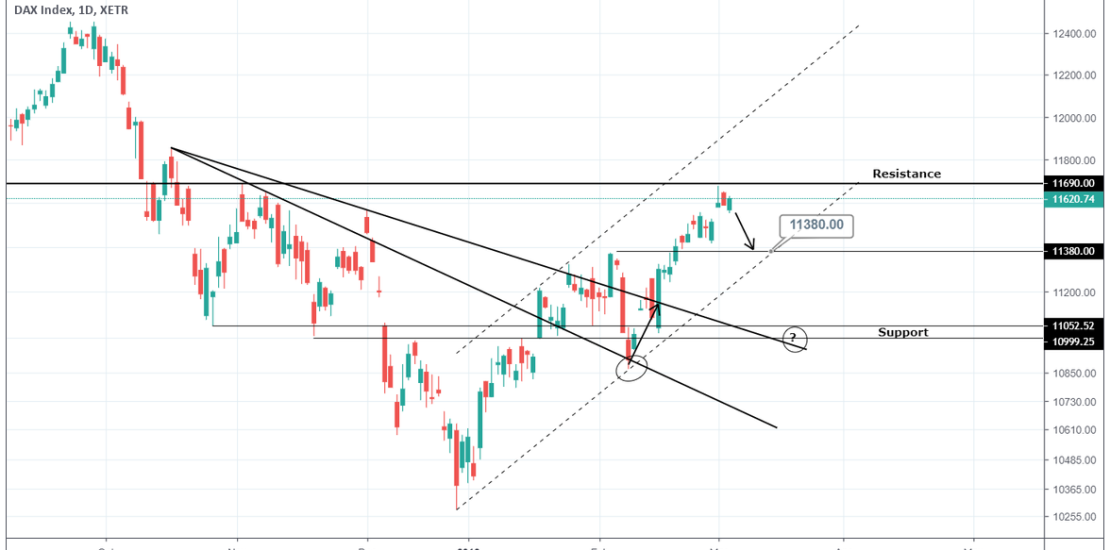
Pattern: 1D Channel Up. Signal: Bearish as the price has been rejected on the 1W Resistance. Target: 11380 (the Channel’s Higher Low). Tradingview link: https://www.tradingview.com/chart/DAX/HXf5883J-DAX-Sell-Signal/
-
PALLADIUM Buy Signal
- March 5, 2019
- Posted by: Tradingshot Articles
- Category: Uncategorized
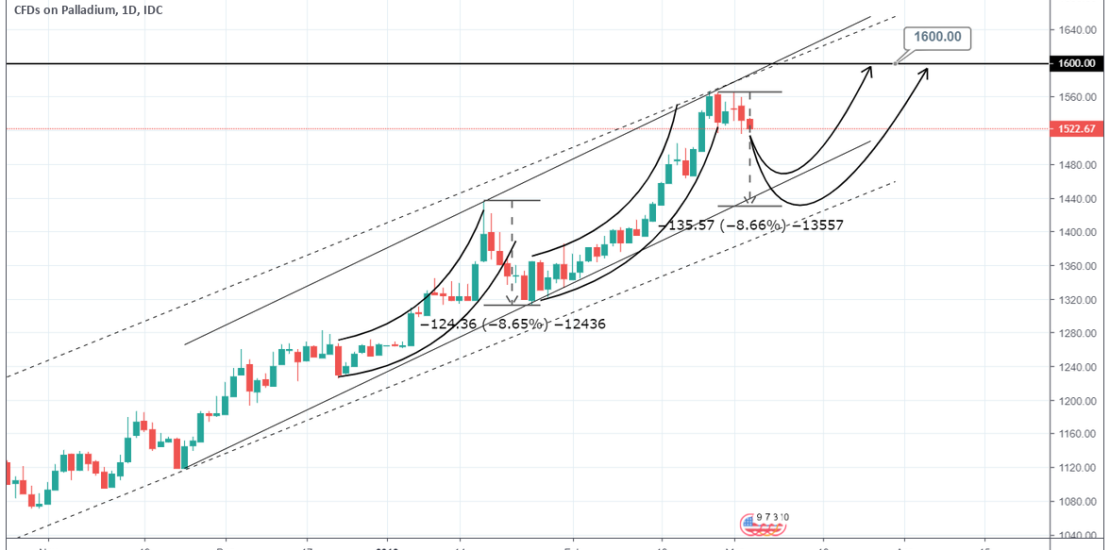
Pattern: Channel Up on 1D. Signal: Bullish once 1) the price test the Higher Low and 2) completes a -8.65% pull back. Target: 1600. Tradingview link: https://www.tradingview.com/chart/XPDUSD/GlODNGCa-PALLADIUM-Buy-Signal/
-
ETCUSD Time to test the Resistance
- March 5, 2019
- Posted by: Tradingshot Articles
- Category: Uncategorized
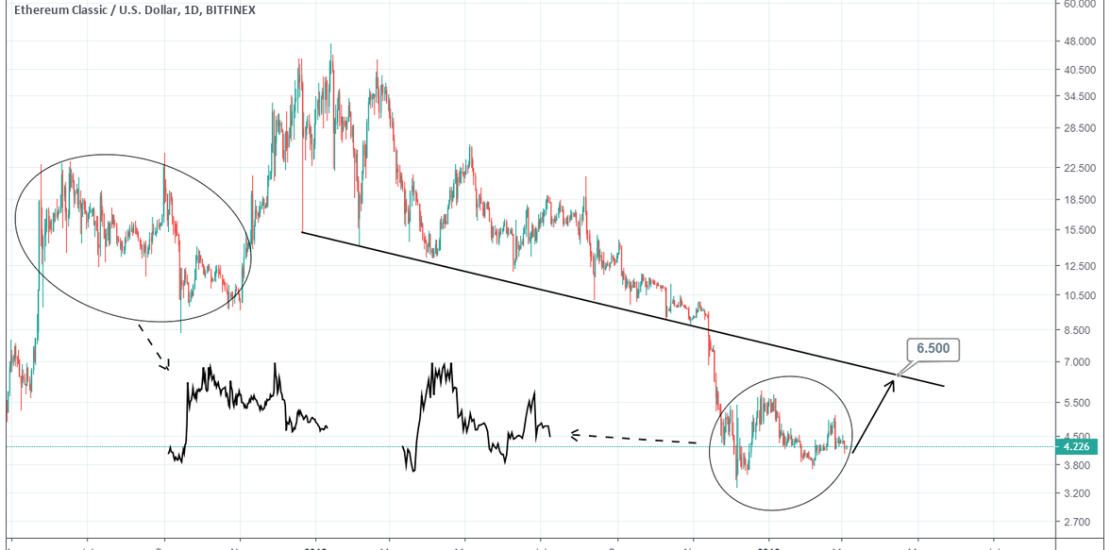
Pattern: Bullish fractal. Signal: Bullish. Target: 6.500 (test of the Resistance trend line). Tradingview link: https://www.tradingview.com/chart/ETCUSD/pAHfetSY-ETCUSD-Time-to-test-the-Resistance/
-
BITCOIN The bottom is in. Would you miss this chance in 2015?
- March 5, 2019
- Posted by: Tradingshot Articles
- Category: Cryptocurrency
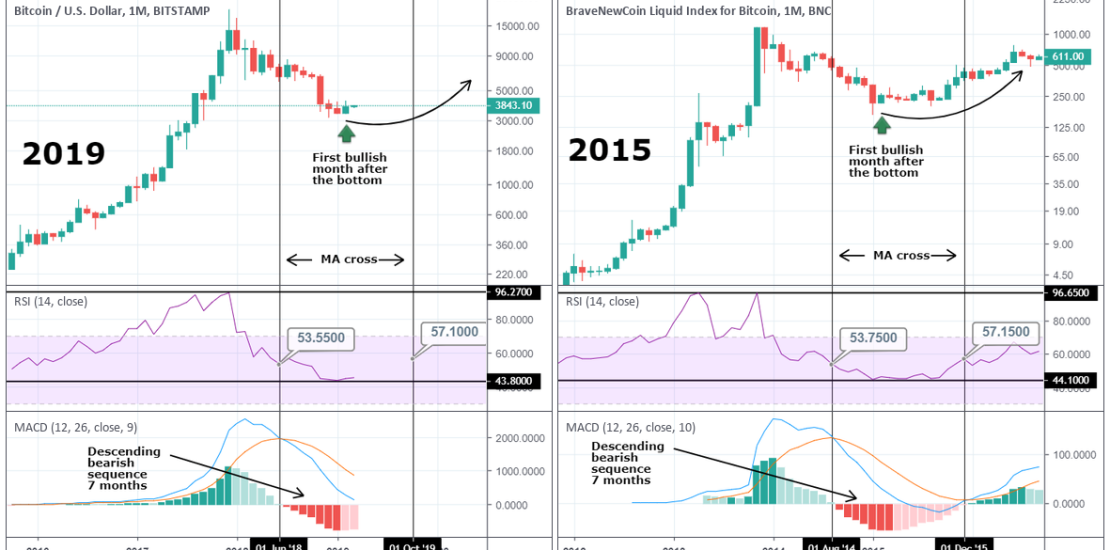
Similarities of now (2019) and then (2015) showing that the bottom is already in and after some months of consolidation we will start seeing higher and higher prices. * RSI 2019: the RSI peaked at 96.2700 on the ATH then dropped to 43.800, near the level it is currently consolidating. The bearish MA cross took place with
-
XAUUSD Buy Signal
- March 4, 2019
- Posted by: Tradingshot Articles
- Category: Uncategorized
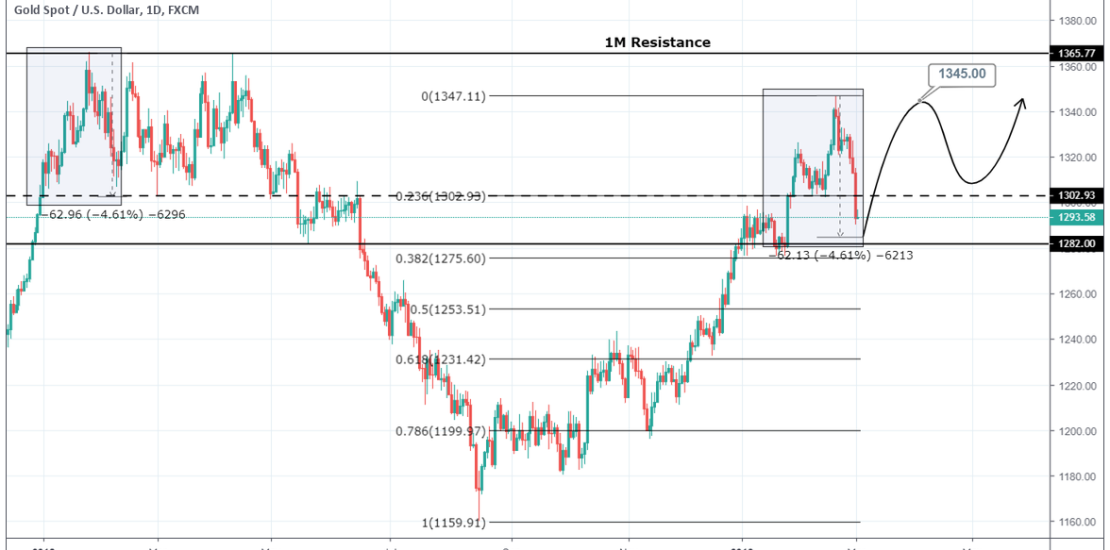
Pattern: Fibonacci retracement to 0.382. Signal: Bullish as a similar fractal points to a bounce on a -4.61% pull back from the top. Target: 1345 (the previous top). Tradingview link: https://www.tradingview.com/chart/XAUUSD/pTnStnkR-XAUUSD-Buy-Signal/
-
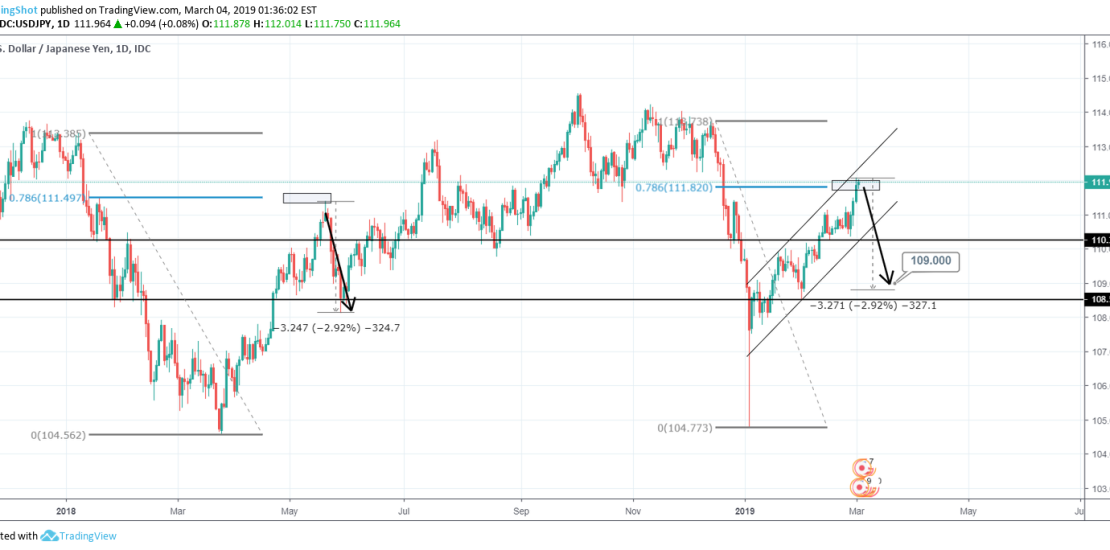
USDJPY Sell Signal
- March 4, 2019
- Posted by: Tradingshot Articles
- Category: Uncategorized
Pattern: Fibonacci retracement to 0.786. Signal: Bearish after identifying a similar fractal on the previous 1W Resistance/ Support levels. Target: 109.000 (just above a -2.92% pull back). Tradingview link: https://www.tradingview.com/chart/USDJPY/8hvy6zu8-USDJPY-Sell-Signal/