2019 February
-
ICXUSD 37% profit opportunity
- February 28, 2019
- Posted by: Tradingshot Articles
- Category: Uncategorized
No Comments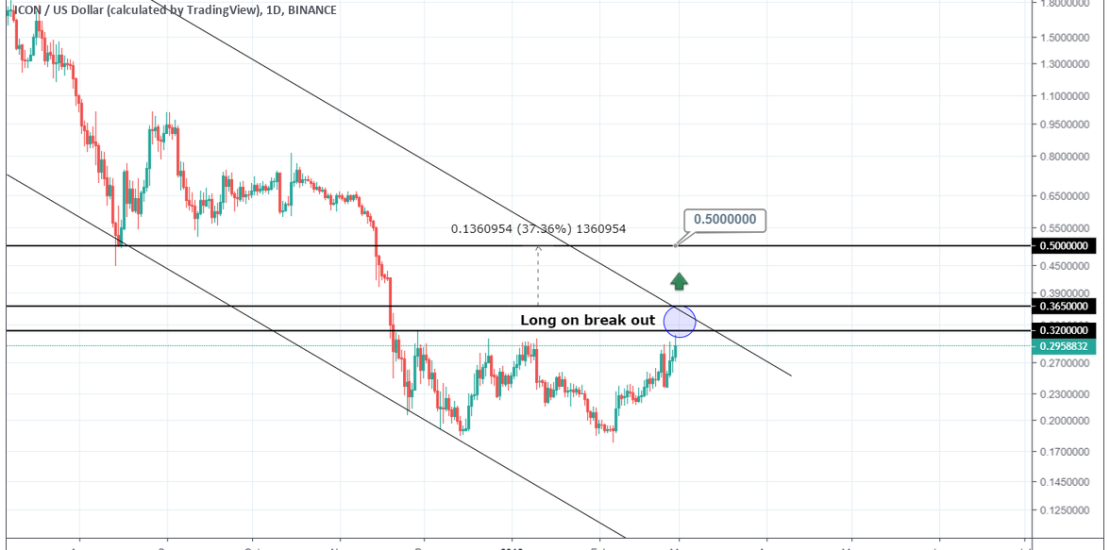
CON is on the verge of a bullish break out. It is approaching both the final 1D Resistance and the Lower High of the 1M Channel Down. I am looking to buy on the break out of this level (0.365000). Target: 0.50000. Tradingview link: https://www.tradingview.com/chart/ICXUSD/vUtbXeqW-ICXUSD-37-profit-opportunity/
-
THETAUSD Sell Signal 30% profit potential
- February 28, 2019
- Posted by: Tradingshot Articles
- Category: Uncategorized
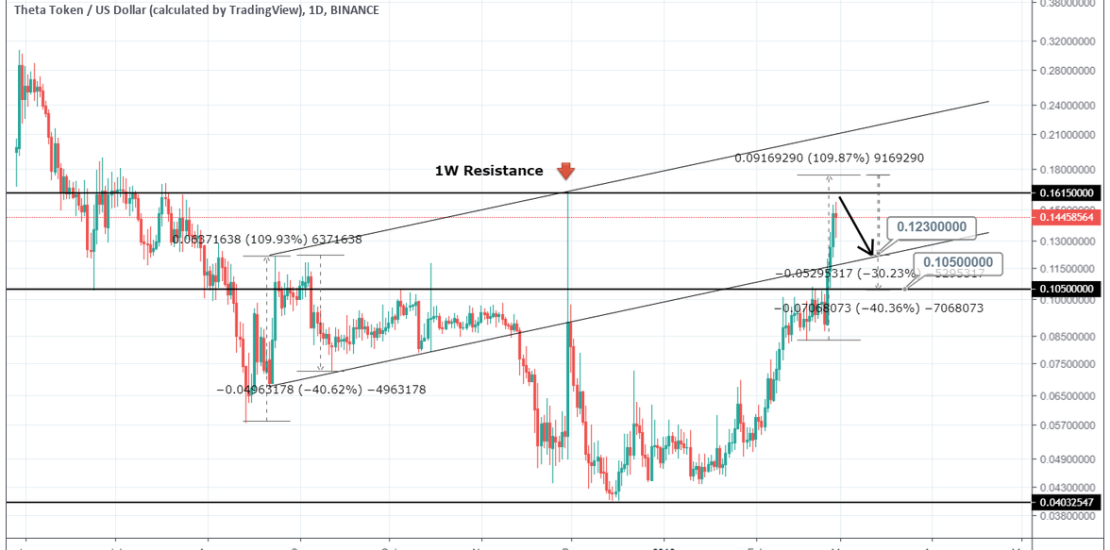
Theta is near the end of its extraordinary bullish run and the massive +290% gains. The 1W Resistance is calling for a sell at or just above it. I am looking at a 30% – 40% downside from there. Targets: 0.12300, 0.10500. Tradingview link: https://www.tradingview.com/chart/THETAUSD/88jwQV9F-THETAUSD-Sell-Signal-30-profit-potential/
-
DASHUSD No long term buy signal yet
- February 28, 2019
- Posted by: Tradingshot Articles
- Category: Uncategorized
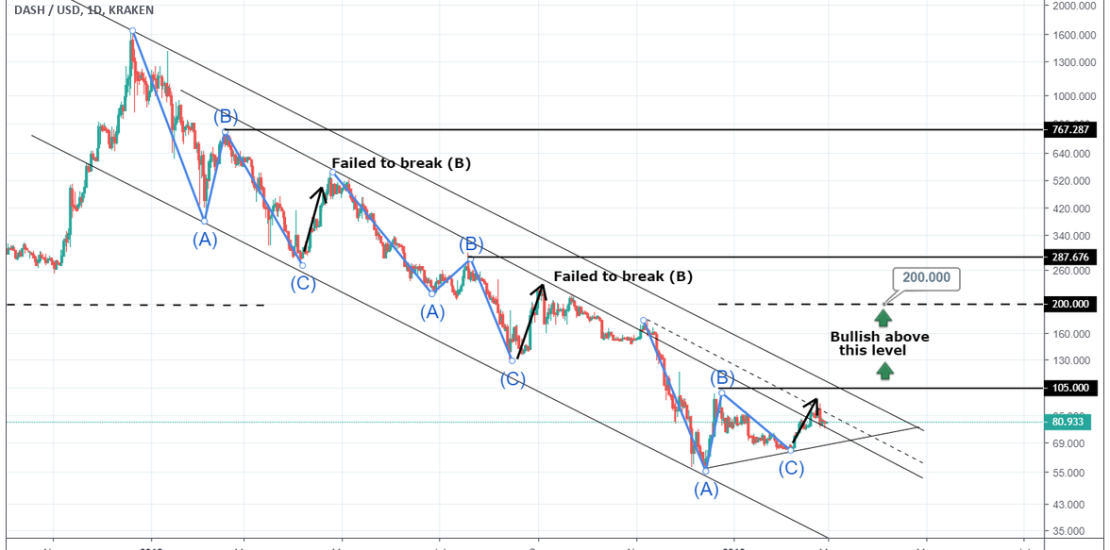
Pattern: Channel Down on 1W. Signal: Bullish if 105.000 breaks. The last two previous attempts to break those waves failed which resulted into Lower Lows. Target: 200.000. Tradingview ink: https://www.tradingview.com/chart/DASHUSD/WfwkOboJ-DASHUSD-No-long-term-buy-signal-yet/
-
GBPJPY Approaching a Sell Signal
- February 27, 2019
- Posted by: Tradingshot Articles
- Category: Uncategorized
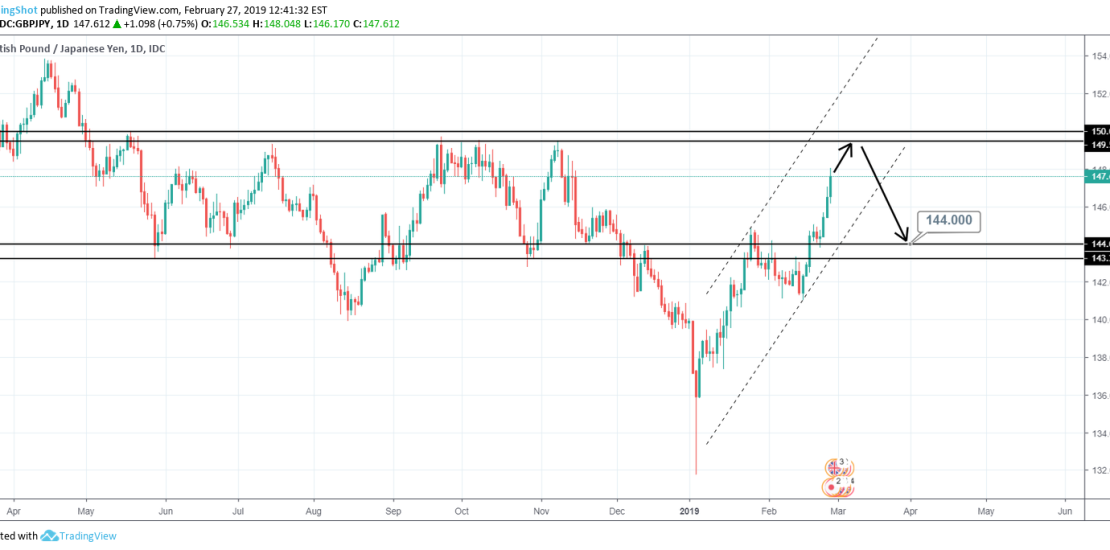
Pattern: Channel Up on 1D approaching 1W Resistance. Signal: Bearish on the 1W Resistance. Target: 144.000 (1D Support). Tradingview link: https://www.tradingview.com/chart/GBPJPY/vtRqw1dS-GBPJPY-Approaching-a-Sell-Signal/
-
GBPUSD Sell Signal
- February 27, 2019
- Posted by: Tradingshot Articles
- Category: Uncategorized
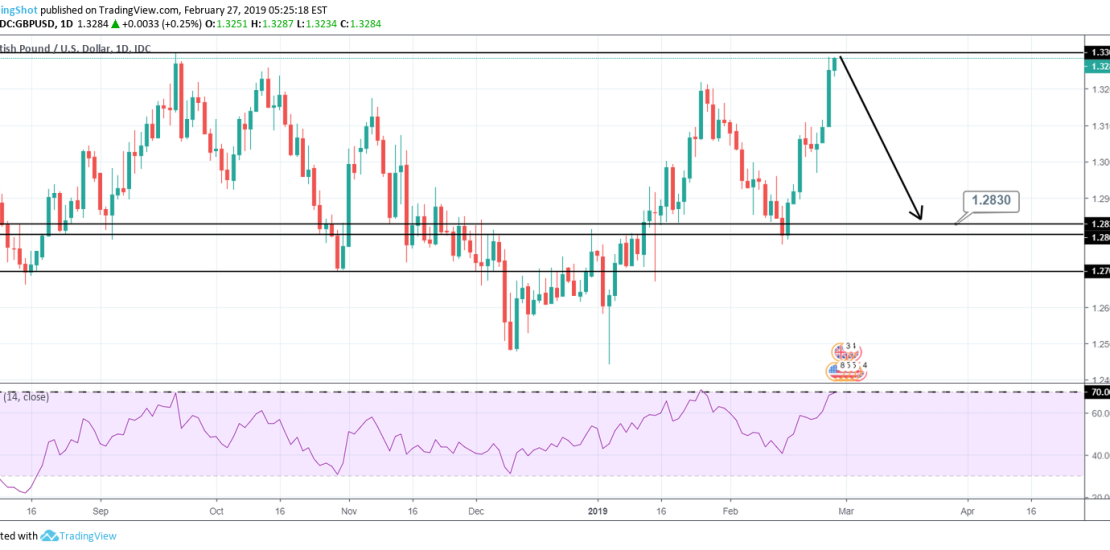
Pattern: Inverse Head and Shoulders on 1D. Signal: Bearish near the 1.3300 1D Resistance and the RSI turning 70.000. Target: 1.2830. Tradingview link: https://www.tradingview.com/chart/GBPUSD/4vdqf1Y4-GBPUSD-Sell-Signal/
-
ONTUSD 70% profit opportunity
- February 26, 2019
- Posted by: Tradingshot Articles
- Category: Uncategorized
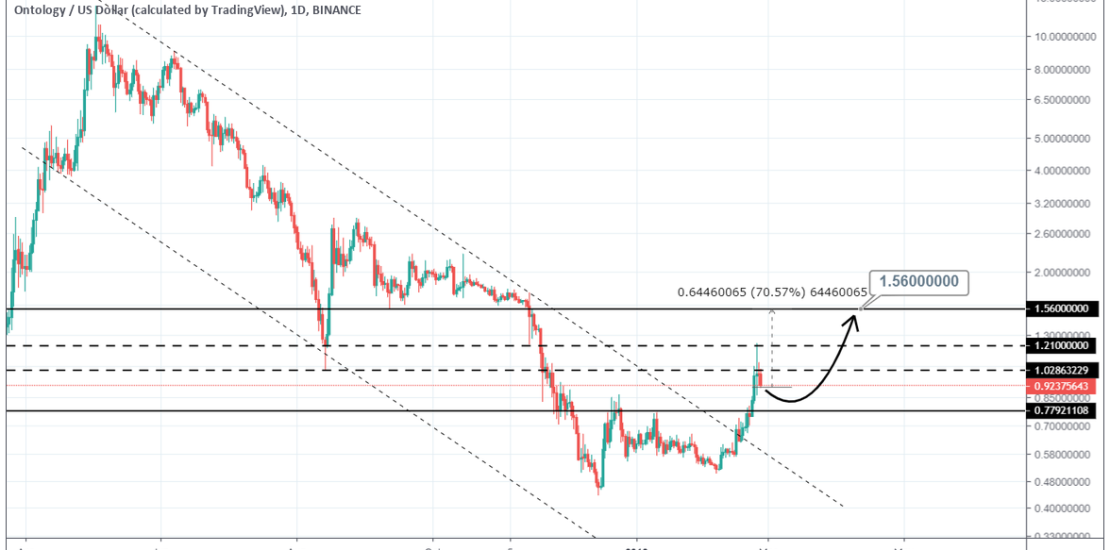
Pattern: Upside cross of the 1W Channel Down and 1W resistance zone of the previous Low. Signal: Bullish. Target: 1.56000. Tradingview link: https://www.tradingview.com/chart/ONTUSD/YMfXspqm-ONTUSD-70-profit-opportunity/
-
Cardano targets 0.08300.
- February 24, 2019
- Posted by: Tradingshot Articles
- Category: Cryptocurrency
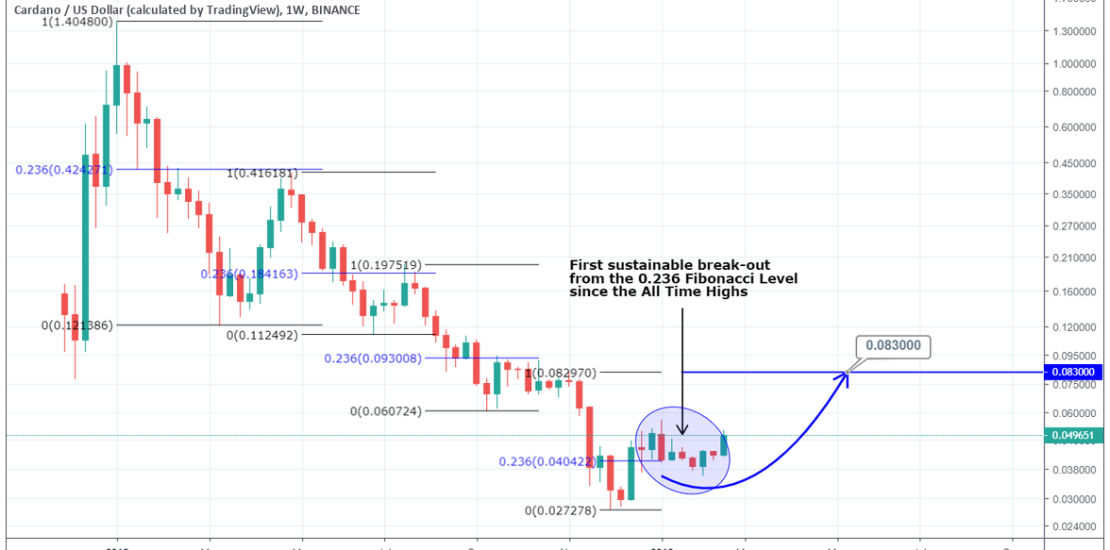
Simple Fibonacci levels provide the bullish signal here. Since the All time Highs, ADAUSD was being rejected on the 0.236 Fibonacci retracement. Last time this level broke the uptrend has been sustained and no Lower Low has been made yet. This is a long term bullish signal. Target: 0.08300 which is the 100% gap fill
-
Bitcoin and the question we should be asking ourselves
- February 23, 2019
- Posted by: Tradingshot Articles
- Category: Cryptocurrency
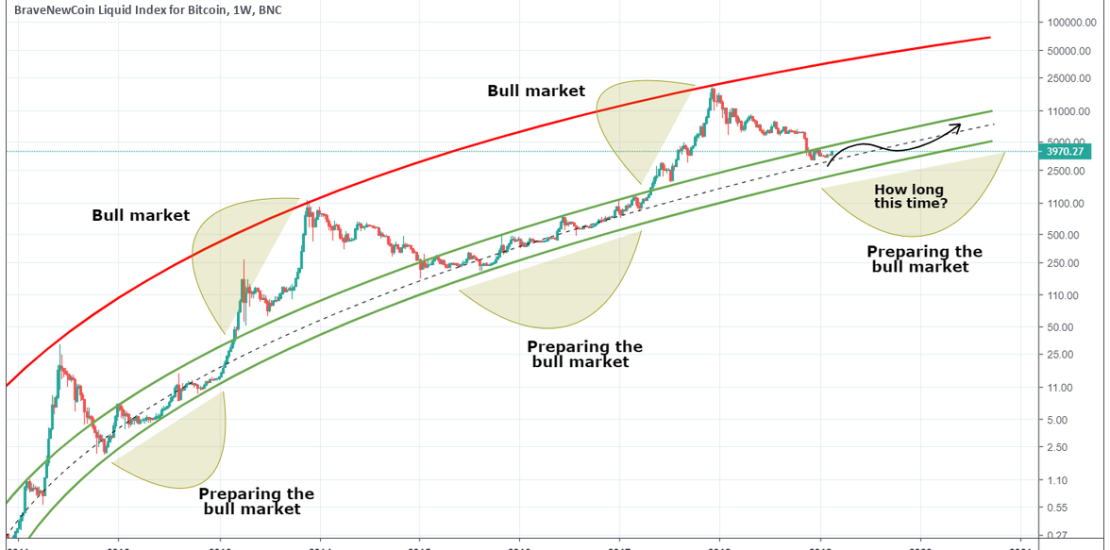
This is the standard BLX chart used to track the candle patterns of Bitcoin from its early stages. The pattern is parabolic and that has been discussed more than enough here. What I want to emphasize most with this analysis is the support provided by the Green Zone. As soon as the price enters this
-
TRXUSD Bullish Signal
- February 22, 2019
- Posted by: Tradingshot Articles
- Category: Uncategorized
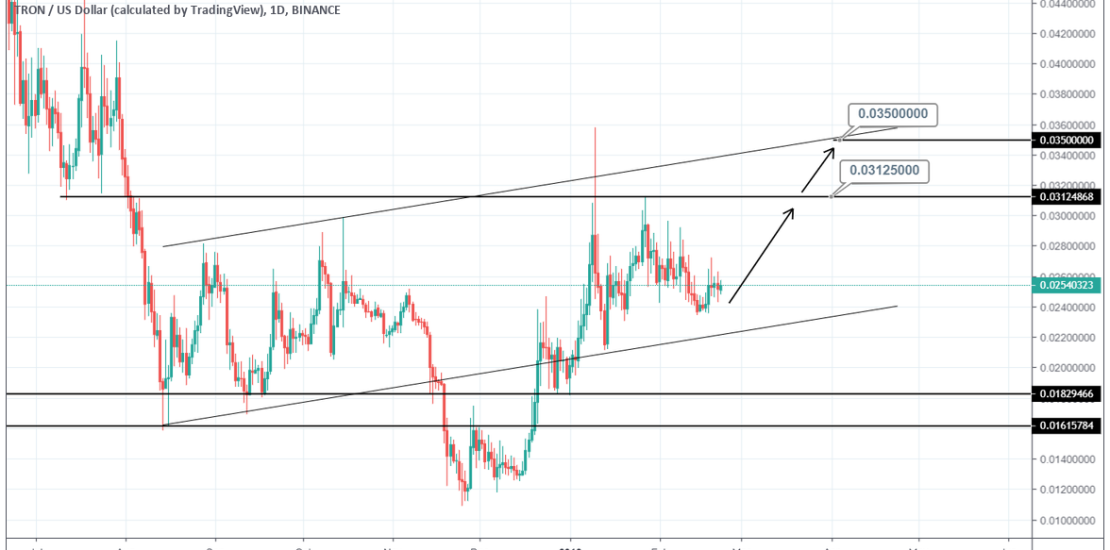
Pattern: Inverse Head and Shoulders (inclining). Signal: Bullish on the Higher Low. Target: TP1 = 0.03125 TP2 = 0.03500. Tradingview link: https://www.tradingview.com/chart/TRXUSD/9eZ9ZpEO-TRXUSD-Bullish-Signal/
-
Is 180 next for Litecoin?
- February 21, 2019
- Posted by: Tradingshot Articles
- Category: Cryptocurrency
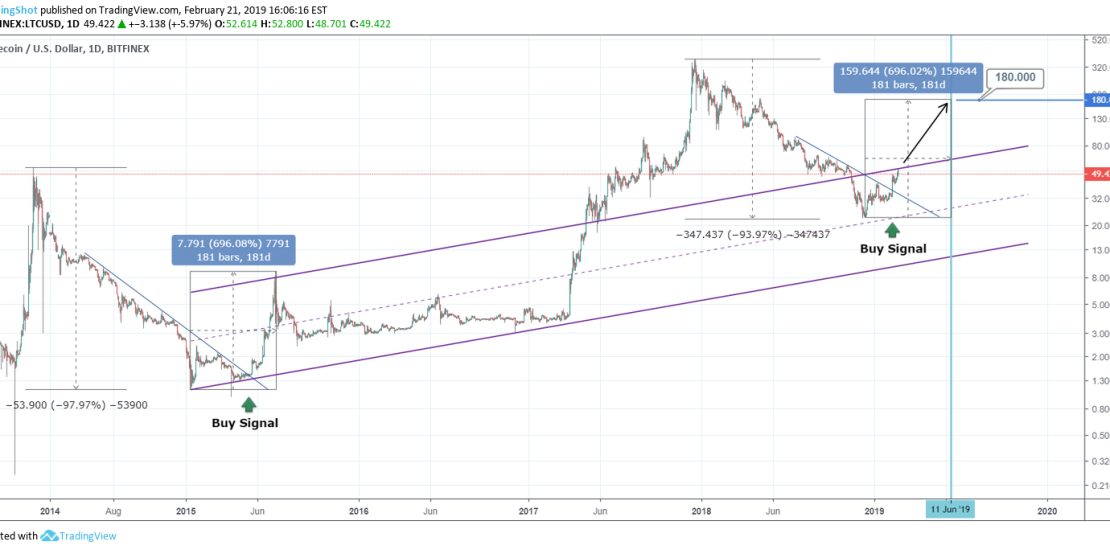
I feel that the chart is clear enough to explain the idea behind it. Litecoin’s two bear markets (2014-2015 and 2018-2019) share a similar pattern behavior. A Buy Signal occurred in May 2015 after the bottom was made in January and a support was formed. The price broke a Lower High trend line and rallied
- 1
- 2

