

-
XAUUSD Trading plan
- June 18, 2020
- Posted by: Tradingshot Articles
- Category: Commodities
No Comments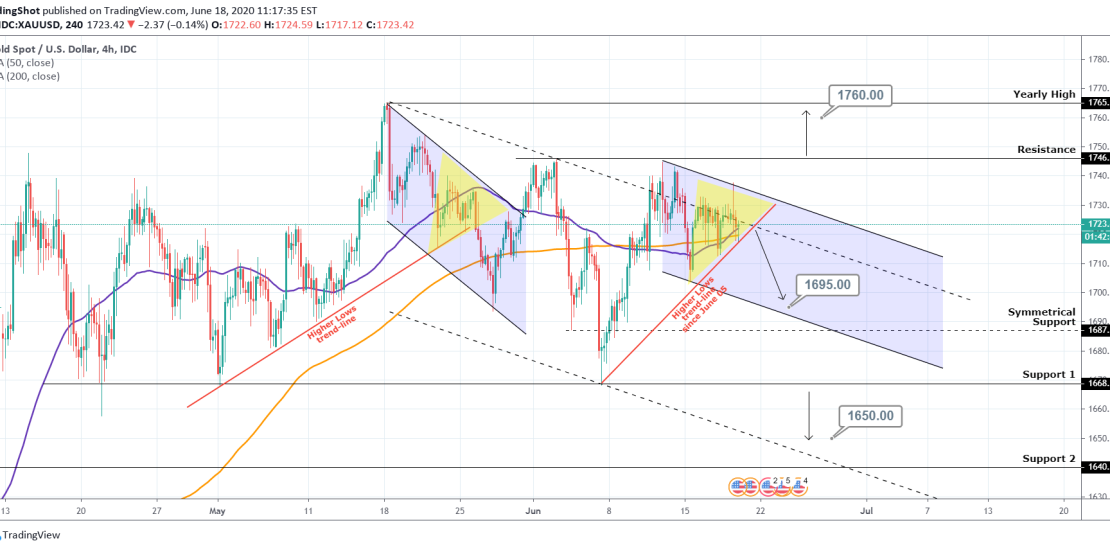
Pattern: Channel Down on 4H. Signal: (A) Bearish is the (red) Higher Lows trend-line breaks. Bearish extension below Support 1. (B) Bullish if the 1746 Resistance breaks. Target: (A) 1695 (Lower Low of the Channel Down), (B) 1760 (just below the Yearly High). ** Please support this idea with your likes and comments, it
-
WTI OIL Trading plan
- June 18, 2020
- Posted by: Tradingshot Articles
- Category: Commodities
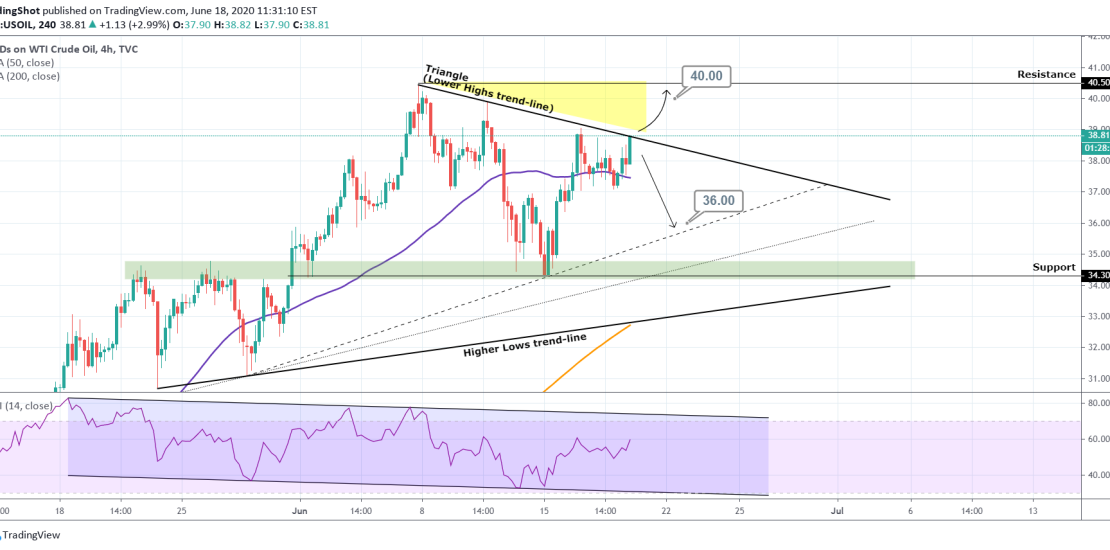
Pattern: Triangle on 4H. Signal: (A) Bullish if the Lower Highs trend-line breaks, (B) Bearish if it gets rejected. Target: (A) 40.00 (just below the Resistance), (B) 36.00 (the first inner Higher Lows trend-line). ** Please support this idea with your likes and comments, it is the best way to keep it relevant and
-
Is CHAINLINK about to break upwards?
- June 17, 2020
- Posted by: Tradingshot Articles
- Category: Cryptocurrency
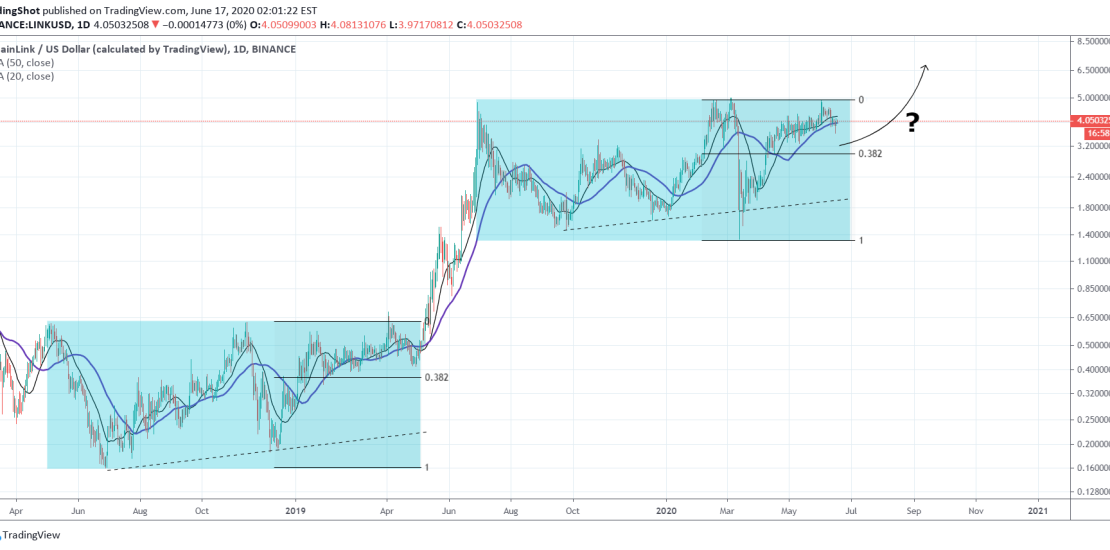
A rather simple chart but what do you make of this? LINKUSD pattern since June 2019 resembles the consolidation of May 2018 – April 2019. This consolidation pattern aggressively broke upwards (along with the majority of cryptos) to form the June top. The key here is the 0.382 Fibonacci. As long as it holds,
-
S&P500 Sell Signal
- June 16, 2020
- Posted by: Tradingshot Articles
- Category: Stock Indices
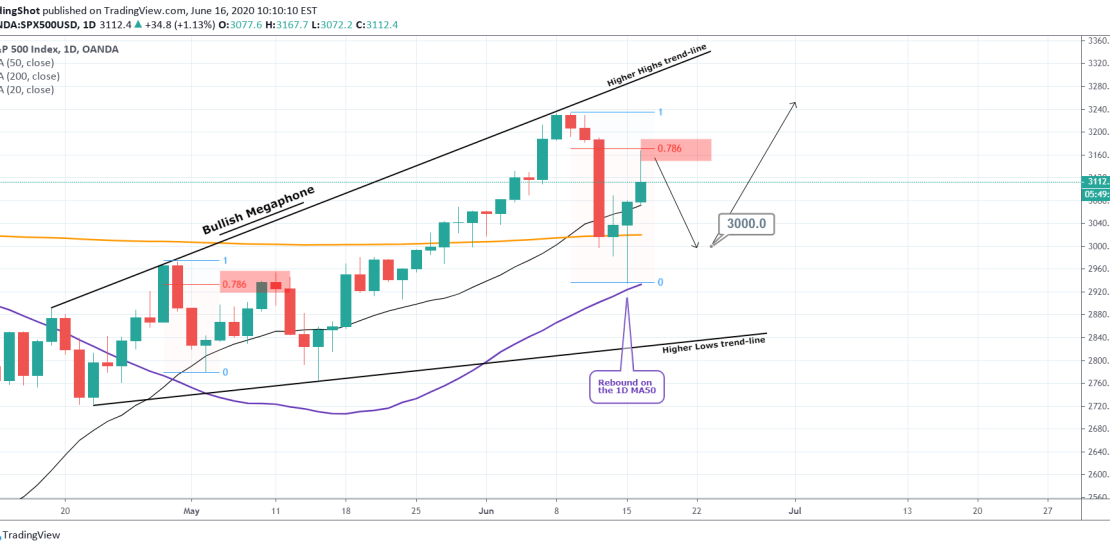
Pattern: Bullish Megaphone Signal: Bearish as it was rejected on the 0.786 Fibonacci. Target: 3000. ** Please support this idea with your likes and comments, it is the best way to keep it relevant and support me. ** Tradingview link: https://www.tradingview.com/chart/SPX500USD/R6dzhsBi-S-P500-Sell-Signal
-
GBPPLN Buy Signal
- June 16, 2020
- Posted by: Tradingshot Articles
- Category: Forex
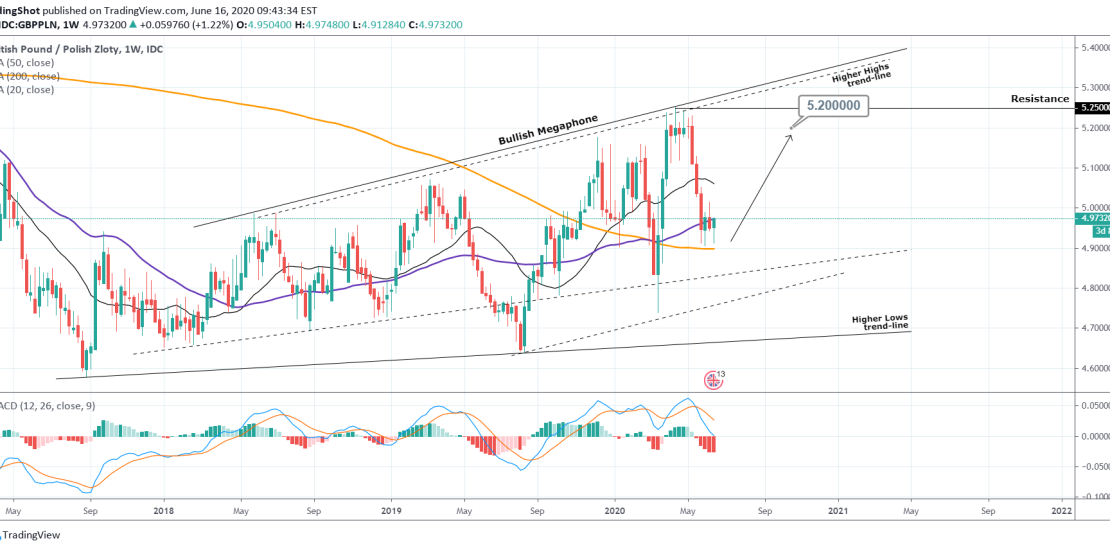
Pattern: Bullish Megaphone on 1W. Signal: Bullish as the price is consolidating on the MA200. Target: 5.2000 (just below the Resistance). ** Please support this idea with your likes and comments, it is the best way to keep it relevant and support me. ** Previous GBPPLN signals: Tradingview link: https://www.tradingview.com/chart/GBPPLN/sIEs5fyv-GBPPLN-Buy-Signal
-
Do Cryptos have something to learn from Nasdaq?
- June 15, 2020
- Posted by: Tradingshot Articles
- Category: Cryptocurrency
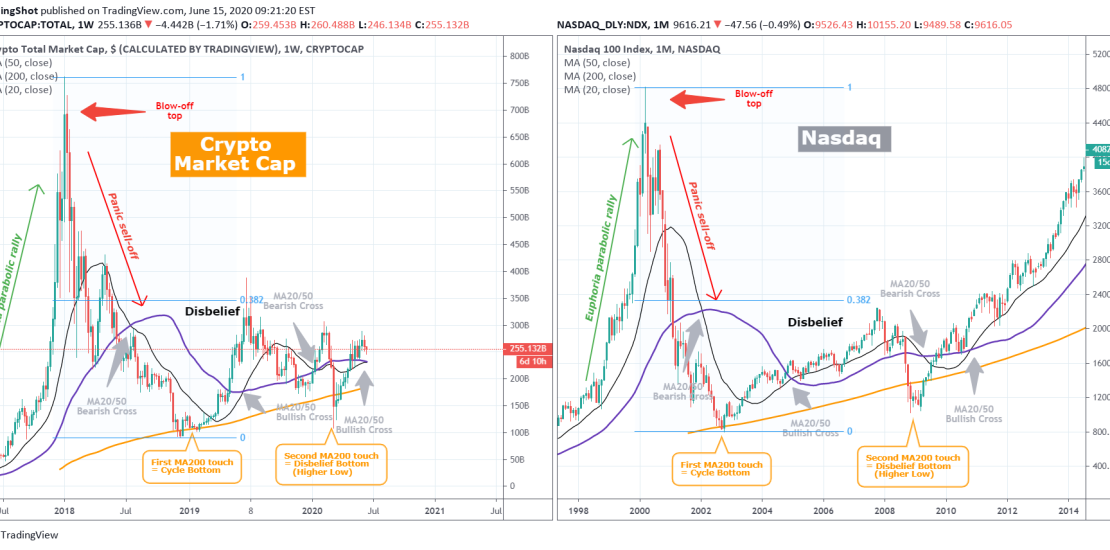
Have you looked at the Crypto Total Market Cap through the lens of stock market like Nasdaq? Why pick Nasdaq for this particular comparison? Simple. The stronget tech index of the world is the perfect fit for the digital currency market ** Before we start, please support this idea with your likes and comments, it
-
USDTHB Long term Sell Signal
- June 12, 2020
- Posted by: Tradingshot Articles
- Category: Forex
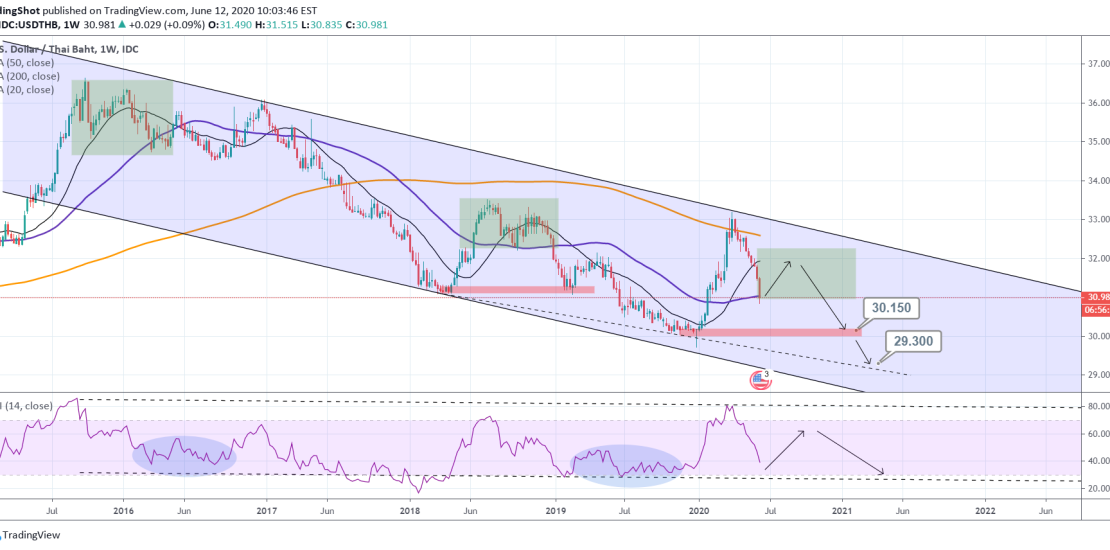
Pattern: Channel Down on 1W. Signal: Bearish after a rebound is completed on the 1W MA200. Target: 30.150 and 29.300 in extension. ** Please support this idea with your likes and comments, it is the best way to keep it relevant and support me. ** Tradingview link: https://www.tradingview.com/chart/USDTHB/vlzWk300-USDTHB-Long-term-Sell-Signal
-
GBPCAD Buy Signal
- June 10, 2020
- Posted by: Tradingshot Articles
- Category: Uncategorized
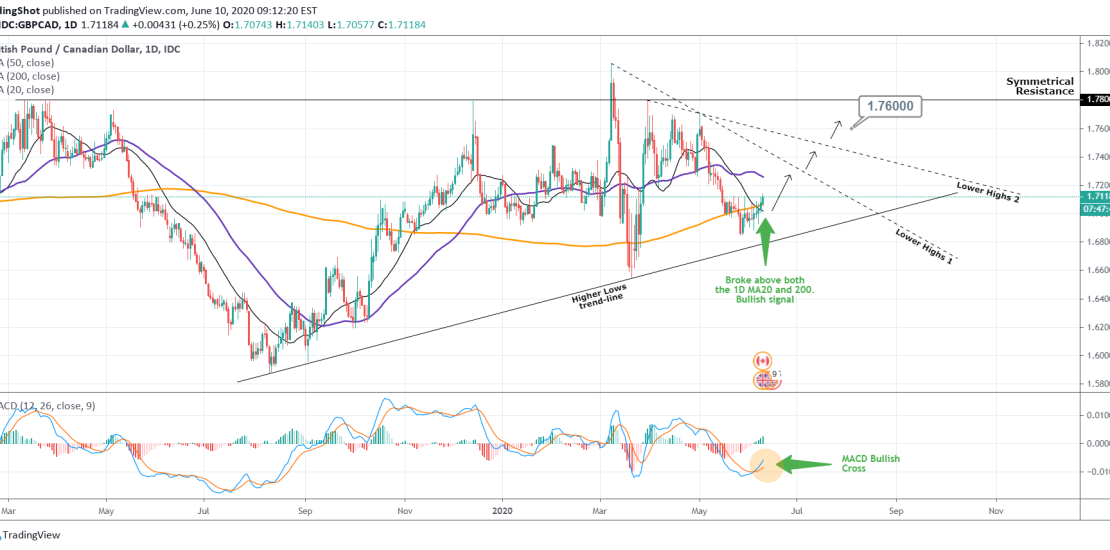
Pattern: Triangle on 1D. Signal: Bullish as: a) the MACD made a Bullish Cross, b) the price broke above both the 1D MA20 and 200. Target: 1.7600 (below the Symmetrical Resistance). Make sure to book profits if you see the price struggling on any of the two Lower Highs trend-lines. ** Please support this
-
EOSBTC Trading Plan
- June 9, 2020
- Posted by: Tradingshot Articles
- Category: Cryptocurrency
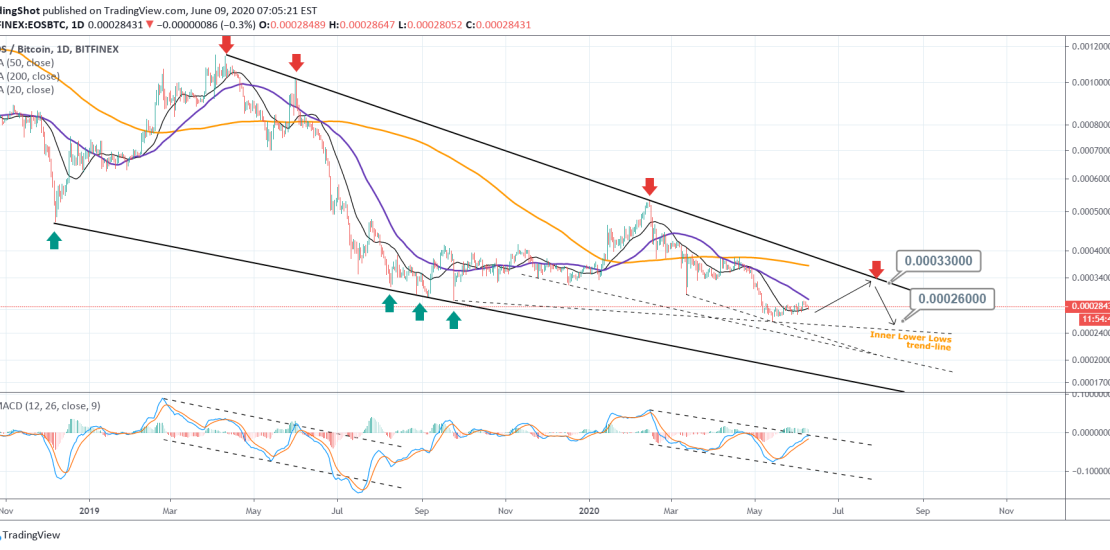
Pattern: Falling Wedge. Signal: Bullish towards the Lower High trend-line of the Wedge and then Bearish towards the Inner Lower Lows trend-line. Target: 0.00033 and 0.00026. Previous EOSBTC signal: Tradingview link: https://www.tradingview.com/chart/EOSBTC/t8nq7y8H-EOSBTC-Trading-Plan
-
BNBBTC Buy Signal
- June 9, 2020
- Posted by: Tradingshot Articles
- Category: Cryptocurrency
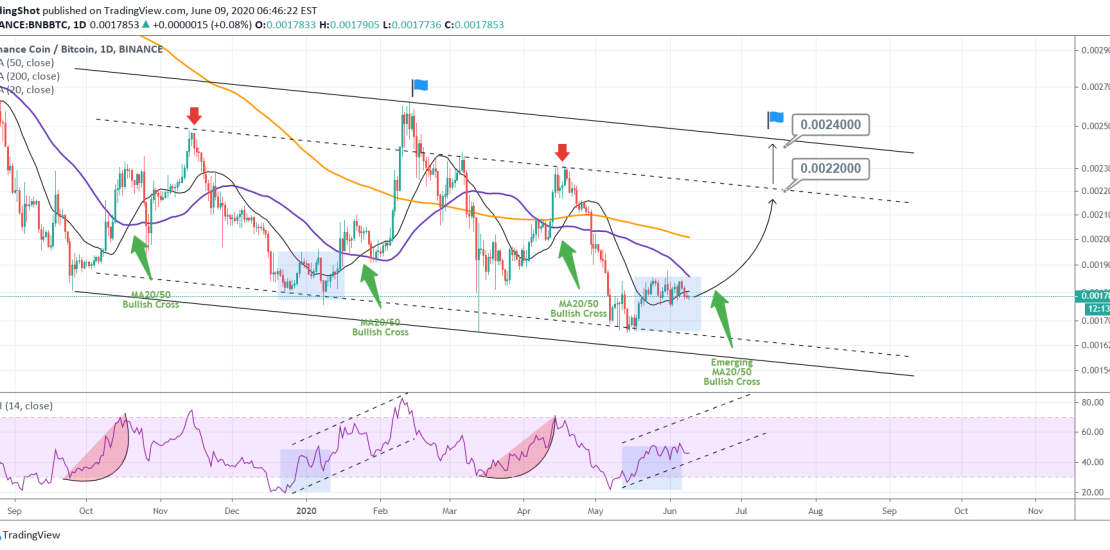
Pattern: Channel Up on 1D. Signal: Bullish as the price is close to forming a MA20/50 Bullish Cross after a rebound on the Channel’s inner (dashed) Lower Low trend-line. Target: 0.002200 (the inner Lower High trend-line) and 0.002400 (the outer Lower High trend-line). Tradingview link: https://www.tradingview.com/chart/BNBBTC/aCKQkZsm-BNBBTC-Buy-Signal