-
GOLD Buy signals
- May 19, 2021
- Posted by: Tradingshot Articles
- Category: Commodities
No Comments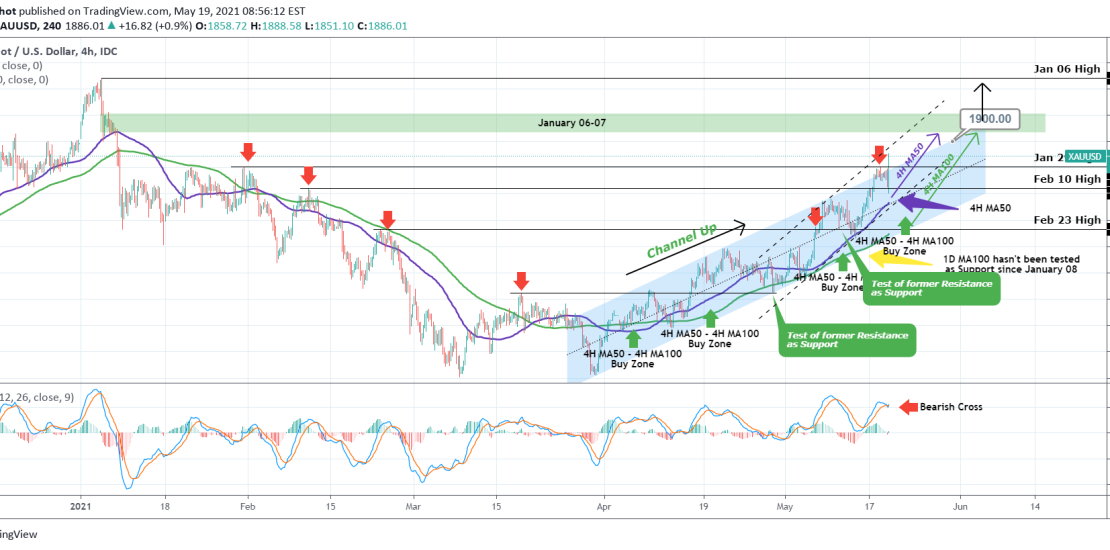
Gold is getting outside of the Channel Up that started on the March 31 bottom (blue channel) and may be forming an even more aggressive Channel Up (dashed lines). The next Resistance Zone is the January 06 – 07 Volatility Cluster (1910 – 1925). The 4H MA50 and 4H MA100 continue to form a
-
NASDAQ Buy Signal
- May 15, 2021
- Posted by: Tradingshot Articles
- Category: Stock Indices
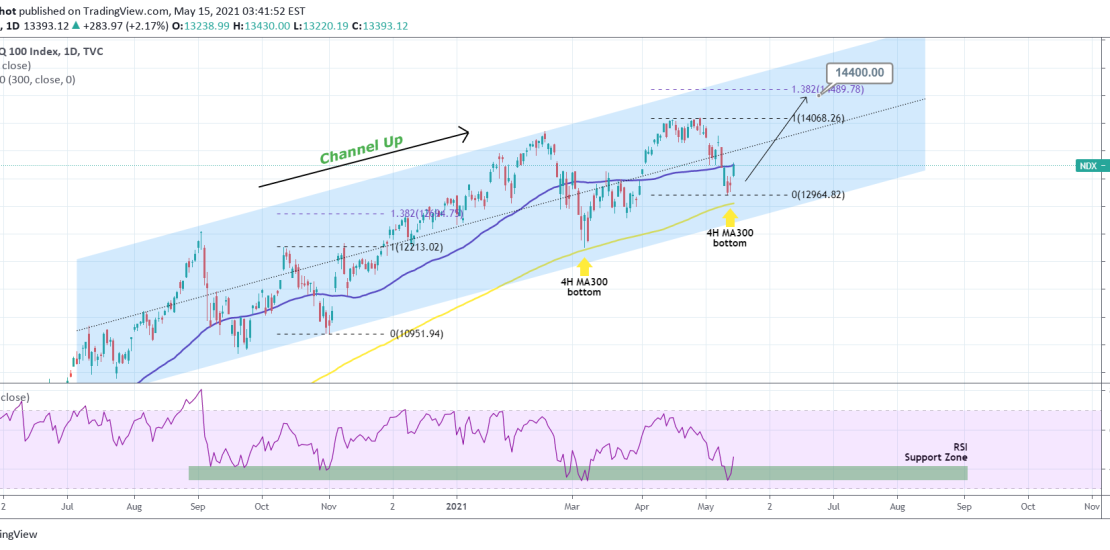
Pattern: Channel Up on 1D. Signal: Buy as the price rebounded (almost) on the 4H MA300 (yellow trend-line), which last time (March 05) formed a bottom. Also the 1D RSI hit the Support Zone that has been in effect for a year. Target: 14400 (slightly below the 1.382 Fibonacci extension). P.S. A long-term possibility
-
DXY Sell Signal
- May 13, 2021
- Posted by: Tradingshot Articles
- Category: Forex
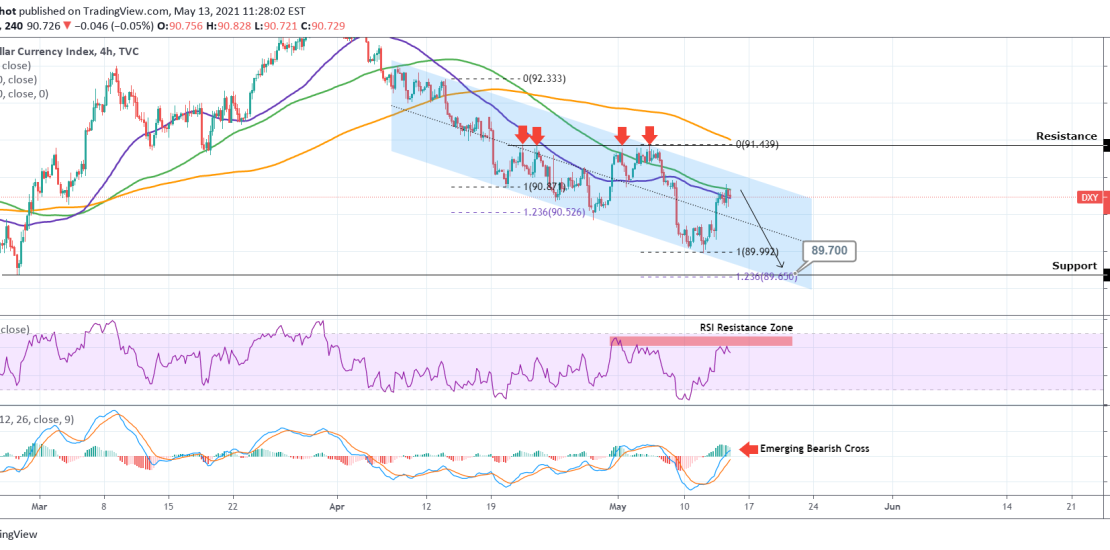
Pattern: Channel Down on 4H. Signal: Sell as the price reached the 4H MA100 (green trend-line) which previous formed a Lower High on the pattern, while the RSI is on its Resistance Zone and the MACD about to make a Bearish Cross. Target: 89.700 (just above the Support and the 1.236 Fibonacci extension). Most
-
S&P500 First Buy Signal (medium-term).
- May 12, 2021
- Posted by: Tradingshot Articles
- Category: Stock Indices
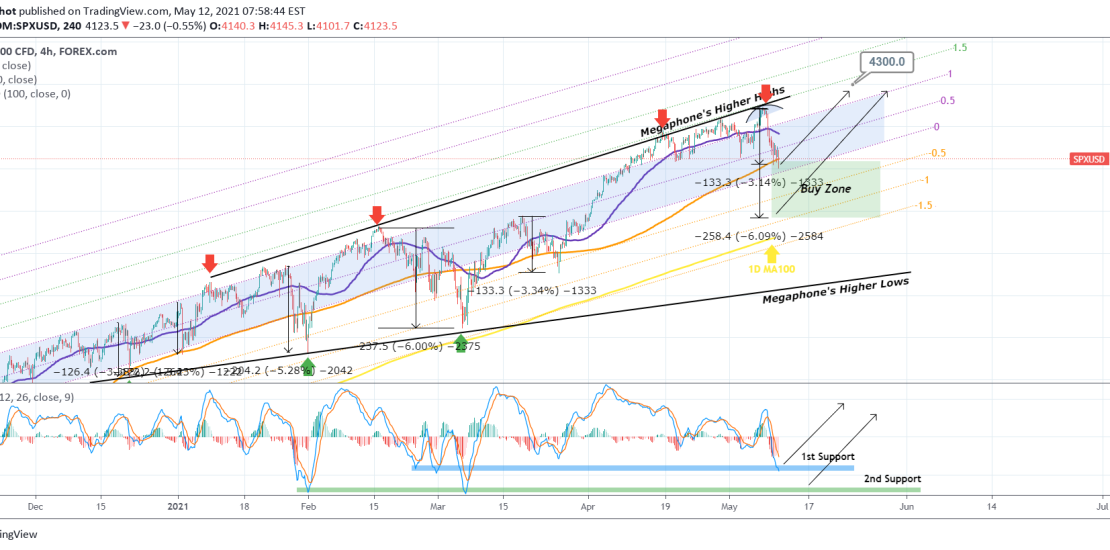
Pattern: Bullish Megaphone on 4H. Signal: Buy as the price completed a -3% pull-back. Second buy signal when it completes a -6% pull-back as since December every -3% to -6% correction was followed by a rally. Also the MACD hit its 1st Support. Target: 4300 (slightly below the 1.5 Fibonacci extension of the Channel).
-
GOLD Buy signals short-term
- May 12, 2021
- Posted by: Tradingshot Articles
- Category: Commodities
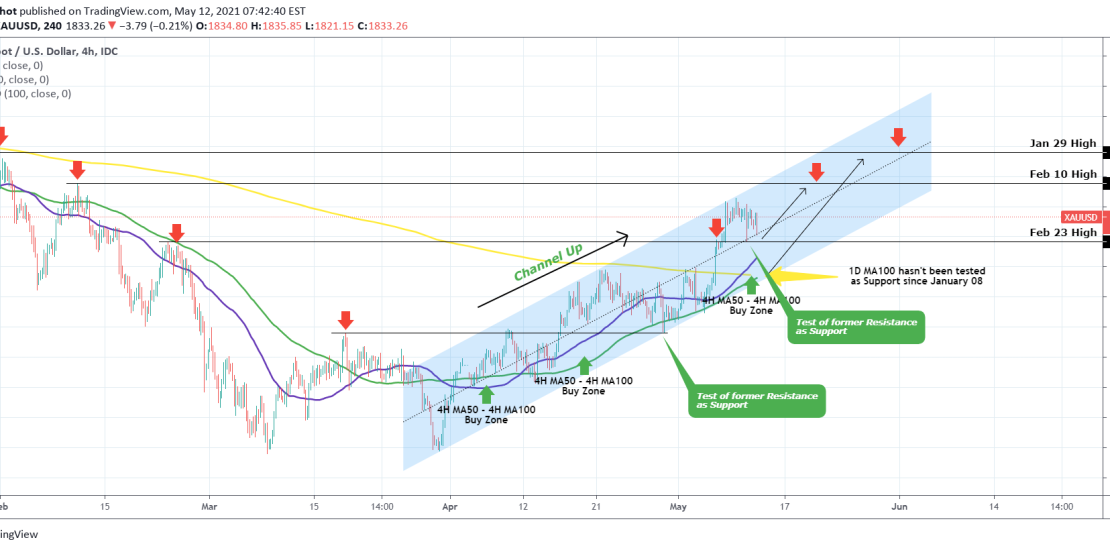
Pattern: Channel Up on 4H. Signal: Buy as the price successfully tested the former 1816.50 Resistance as Support. Stronger buy zone within the 4H MA50 (blue trend-line) and 4H MA100 (green trend-line). Target: 1855 and 1875 in extension (i.e. slightly below the next Resistance levels (and former Lower Highs during the February downtrend)). Former
-
DXY weak below the 91.435 Resistance and 4H MA200
- May 6, 2021
- Posted by: Tradingshot Articles
- Category: Forex
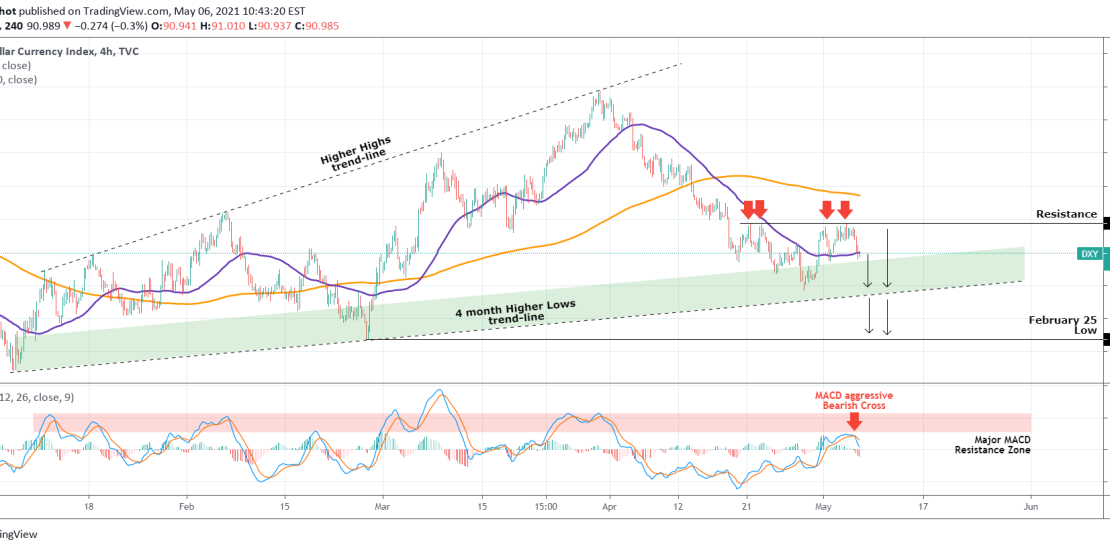
The U.S. Dollar Index (DXY) has been rejected multiple times on the 91.435 Resistance since April 21. This is a sign of weakness on the short-term which may jump onto the long-term too is the 4 month Higher Lows Zone (green) breaks, in which case the target will the the February 25 Low of
-
EURUSD Its perfect symmetry aims at 1.22400
- May 6, 2021
- Posted by: Tradingshot Articles
- Category: Forex
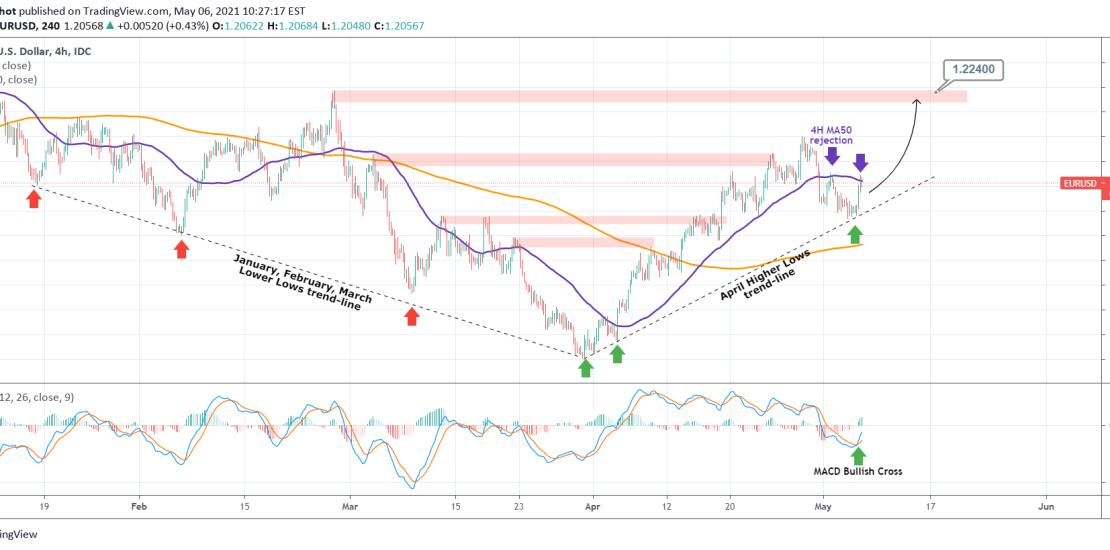
EURUSD has just rebounded off its Higher Lows trend-line, a Support line that has been holding since the start of April. If we get a 4H candle closing above the 4H MA50 (blue trend-line), then the price should aim at 1.22400, which is the February 25 High. As you see the symmetry has been near
-
GOLD broke above the 1D MA100. Major bullish break-out signal.
- May 6, 2021
- Posted by: Tradingshot Articles
- Category: Commodities
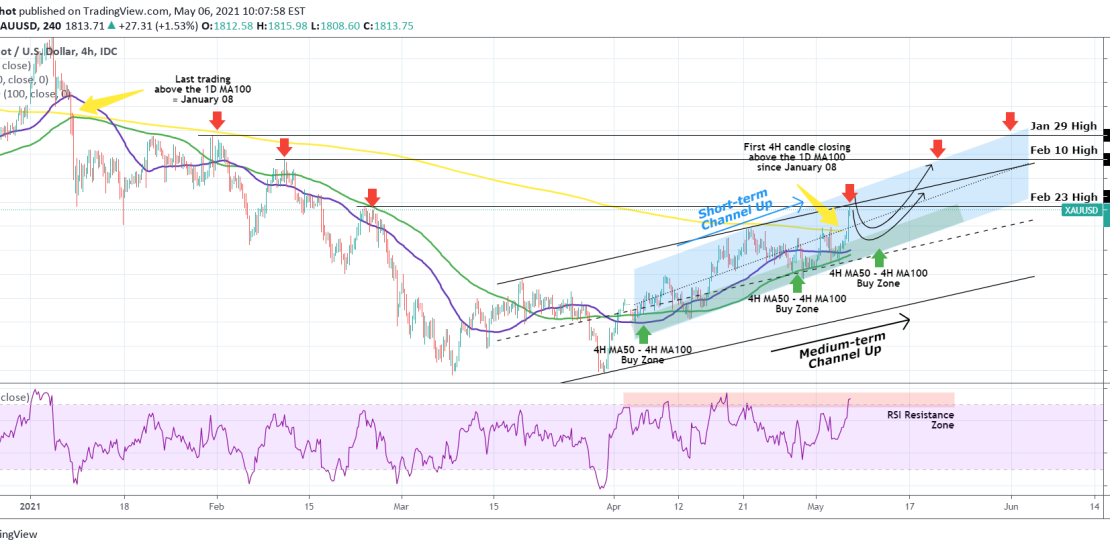
As mentioned on a series of posts, Gold has been trading within a Channel Up since April: This Channel had one major barrier before the short-term bullish sentiment made the leap to the long-term as well, and that was the 1D MA100 (yellow trend-line). The current chart is on the 4H time-frame
-
GOLD 2021 vs 2020
- May 4, 2021
- Posted by: Tradingshot Articles
- Category: Commodities
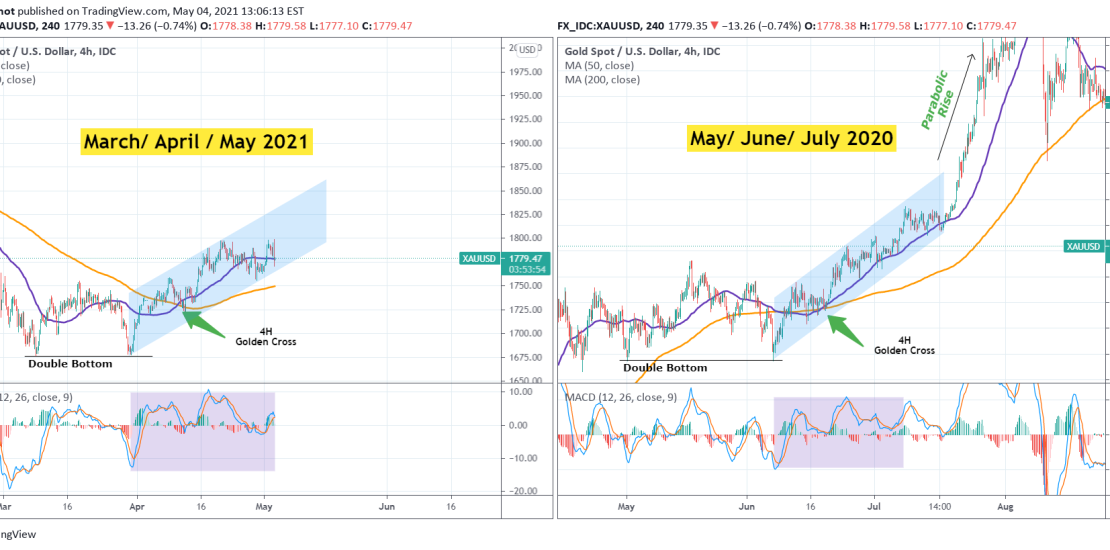
This is a comparison of XAUUSD (Gold) during March/ April / May 2021 and May/ June/ July 2020. As you see there are a few strong similarities: * Both formed a Double Bottom on their start. * A Golden Cross was then formed on the 4H time-frame. * This gave way to a Channel
-
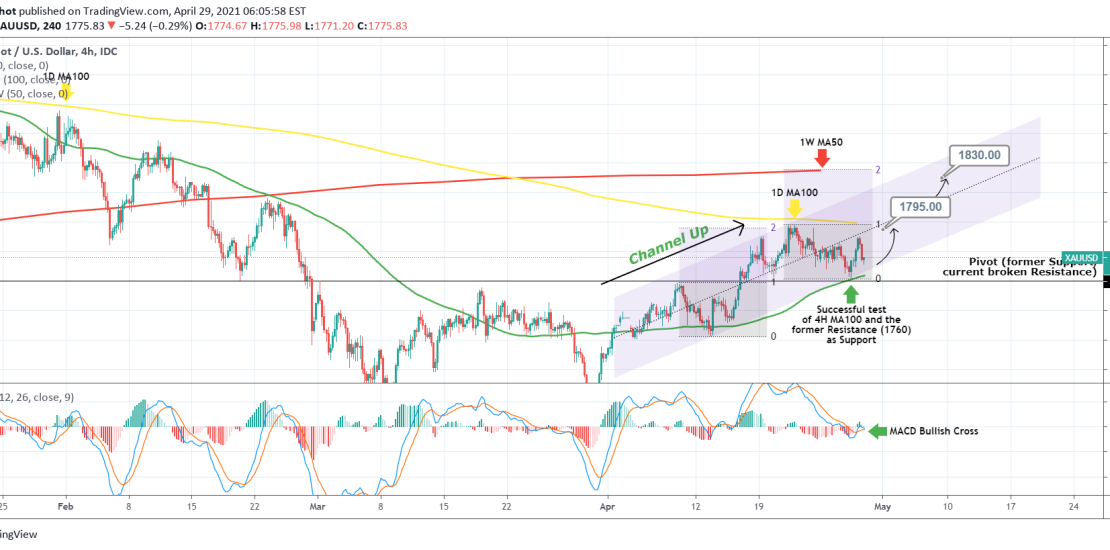
GOLD Successful test of 1760 as Support. Bullish.
- April 29, 2021
- Posted by: Tradingshot Articles
- Category: Uncategorized