

2021 November
-
S&P500 The 1D RSI is overbought on a big red signal
- November 5, 2021
- Posted by: Tradingshot Articles
- Category: Stock Indices
No Comments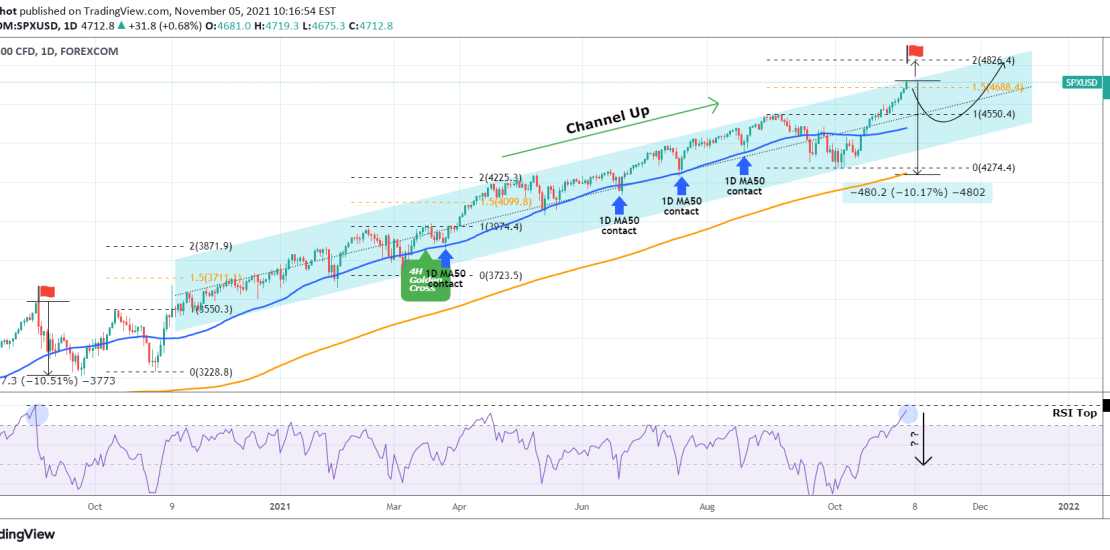
S&P has been trading within a Channel Up ever since the November 2020 U.S. elections. During that time, the RSI on the 1D time-frame has never gone above 76.30. Right now however, it is overbought and approaching the 80.000 Resistance where it was last seen on September 03 2020. As you see on the
-
XAUUSD Trading Plan
- November 4, 2021
- Posted by: Tradingshot Articles
- Category: Commodities
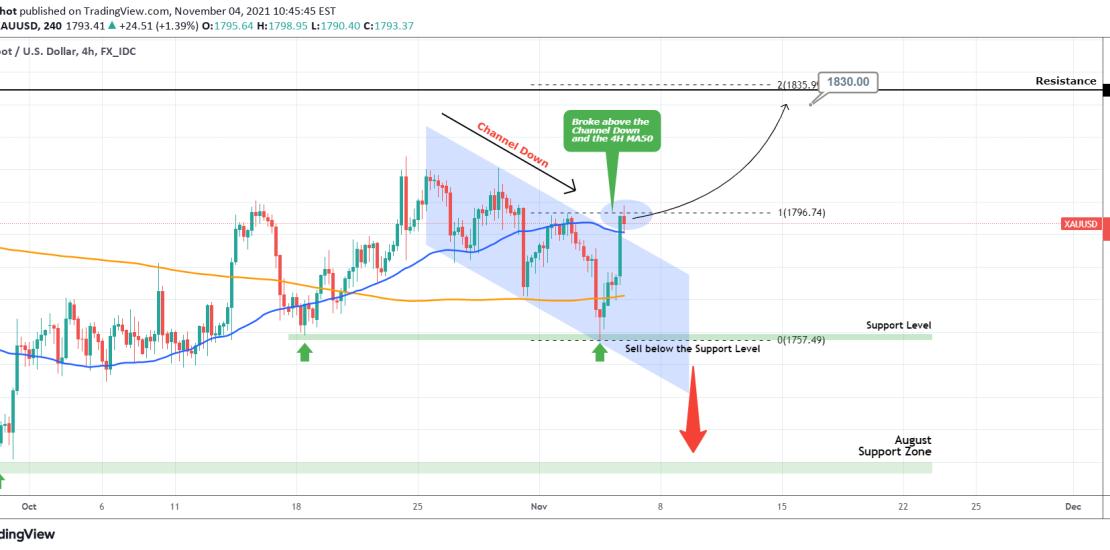
Gold broke above the Channel Down and the 4H MA50 (blue trend-line) in the aftermath of the Fed Press Conference yesterday. This is a short-term buy signal towards the 1834.50 Resistance. On the other hand, if the price breaks below the 1,757.50 Support level, it’s a strong sell signal towards the 1,720 August Support
-
WTI OIL Bearish Reversal pattern
- November 3, 2021
- Posted by: Tradingshot Articles
- Category: Commodities
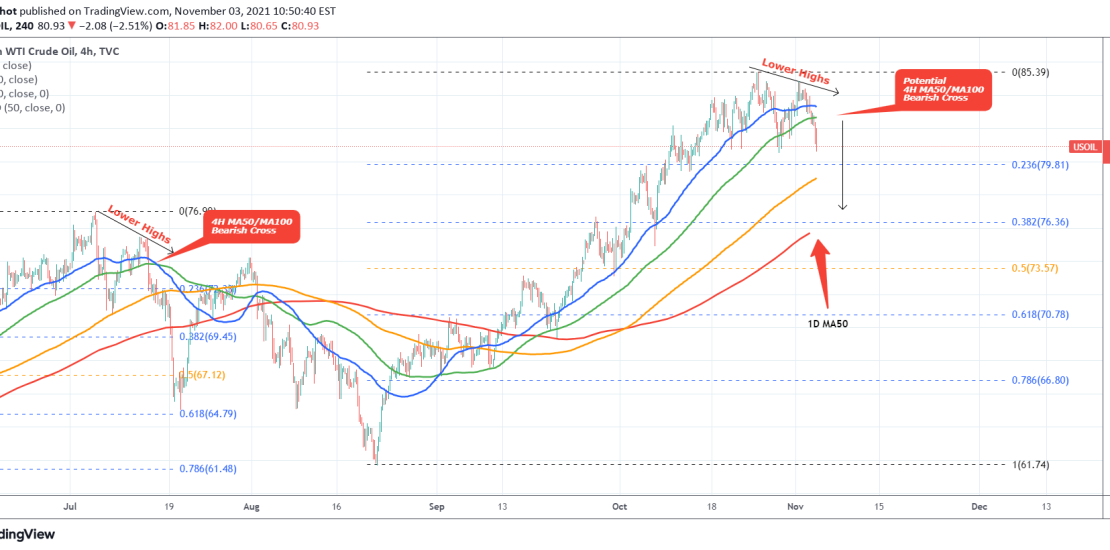
WTI Oil is on a typical Bearish Reversal pattern and the first signs of this were given last week as posted on my most recent analysis: Right now the price is on Lower Highs, similar to the July peak and reversal fractal. If a 4H MA50 (blue trend-line) / MA100 (green trend-line) Bearish Cross
-
AUDNZD Long-term Buy Signal
- November 1, 2021
- Posted by: Tradingshot Articles
- Category: Forex
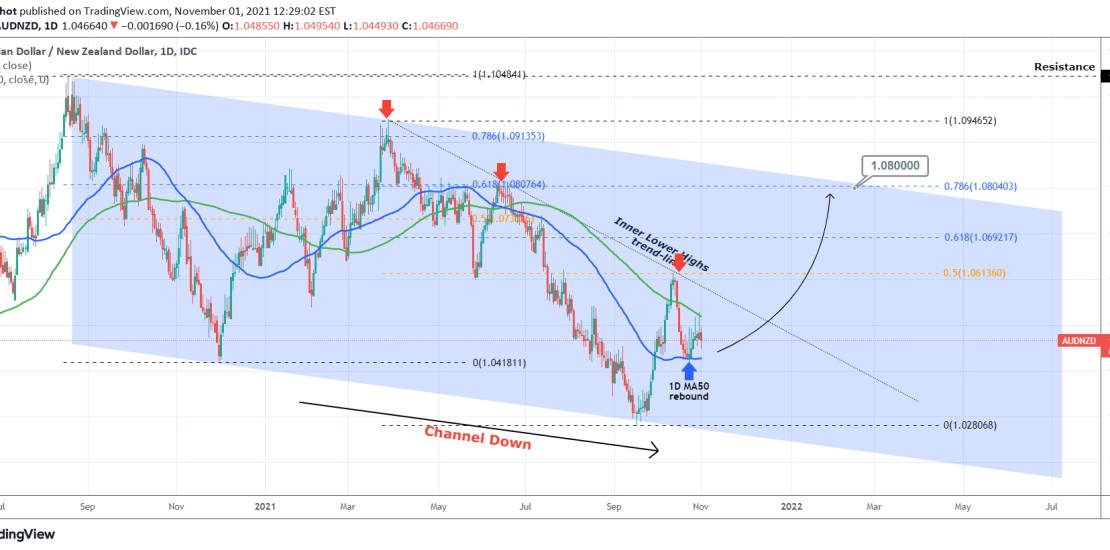
Pattern: Channel Down on 1D. Signal: Buy as the price rebounded on the 1D MA50 (blue trend-line) and is on the bullish leg towards the top (Lower Highs trend-line) of the Channel Down. Target: 1.0800 (the 0.786 Fibonacci extension) as per the previous Lower High leg. Tradingview link: https://www.tradingview.com/chart/AUDNZD/FZz0ojQj-AUDNZD-Long-term-Buy-Signal
-
USDCAD 2022 will be a very bullish year for the pair
- November 1, 2021
- Posted by: Tradingshot Articles
- Category: Forex
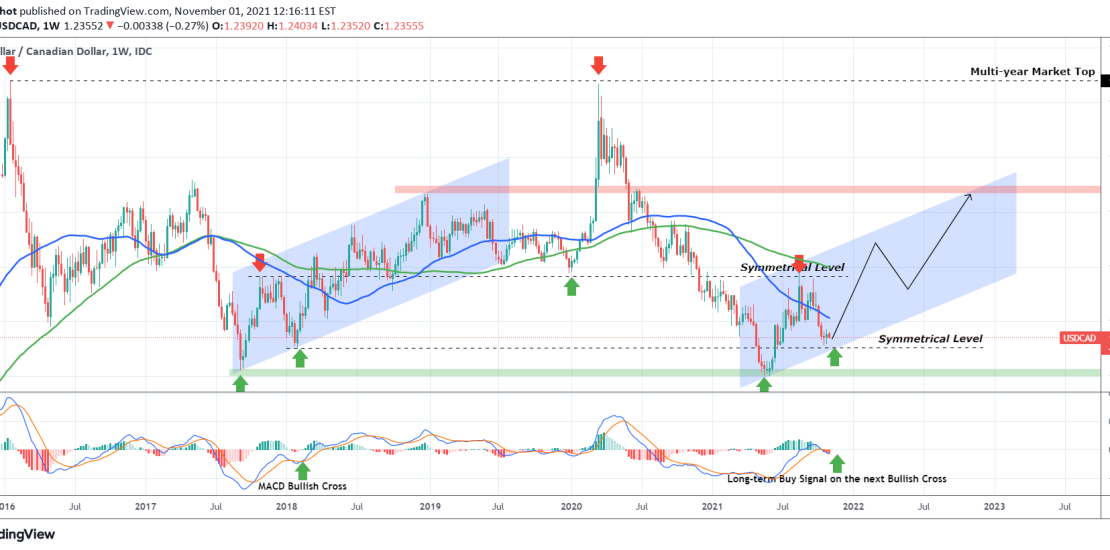
As the title suggests, I expect USDCAD to be bullish for 2022. The reason is the fractal (on this 1W time-frame) from 2017 – 2018 that the pair appears to be replicating. As you see this market follows strict Support and Resistance levels, easily recognizable on the long-term scale. The Multi-year Market Top of
- 1
- 2