

2021 March
-
NATURAL GAS Buy Signal
- March 17, 2021
- Posted by: Tradingshot Articles
- Category: Commodities
No Comments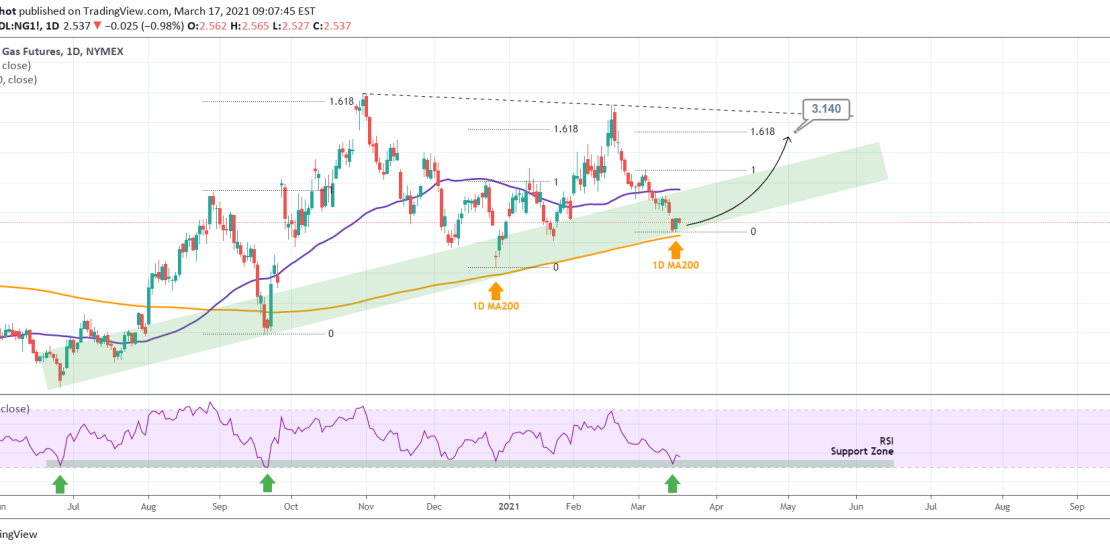
Pattern: Triangle on 1D. Signal: Buy as the price has found support just above the 1D MA200 (orange trend-line) and within the 8-month Higher Lows Zone (green). The RSI also hit its own Support Zone. Target: 3.140 (the 1.618 Fibonacci extension). ** Please support this idea with your likes and comments, it is the
-
S&P500 Bullish Break-out
- March 10, 2021
- Posted by: Tradingshot Articles
- Category: Stock Indices
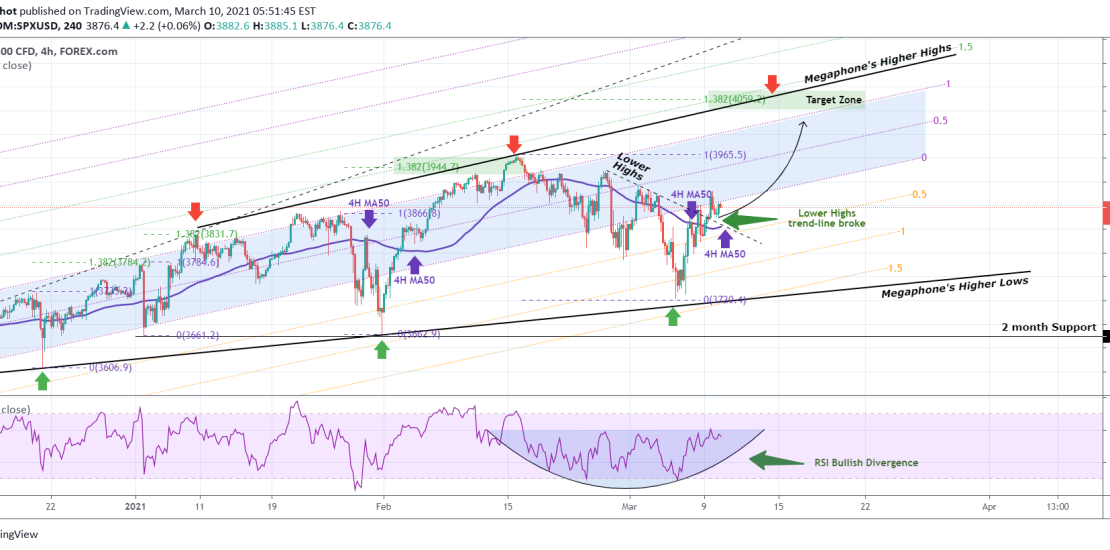
Pattern: Bullish Megaphone on 4H. Signal: Buy as the price broke above the inner Lower Highs trend-line and is turning the 4H MA50 (blue trend-line) into Support. The RSI is on a Bullish Divergence. Target: 4,040 long-term (the 1.382 Fibonacci extension ). Previous S&P signal: ** Please support this idea with your likes and
-
S&P500 Buy Signal
- March 5, 2021
- Posted by: Tradingshot Articles
- Category: Stock Indices
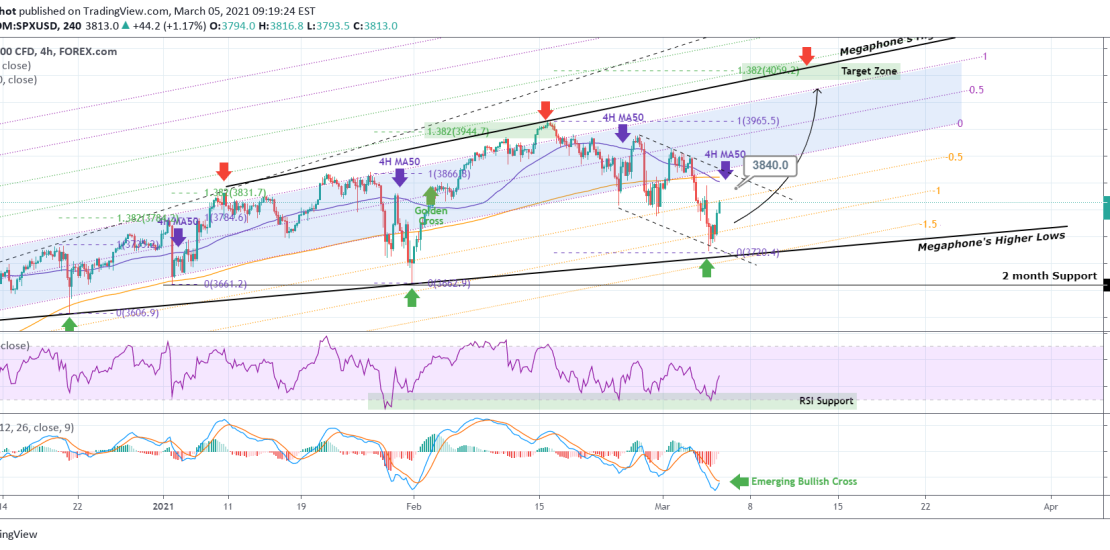
Pattern: Bullish Megaphone on 4H. Signal: Buy as the price just rebounded right above the Megaphone’s Higher Lows trend-line. The RSI did the same on its own Support, while the MACD is close to forming a Bullish Cross. Target: 3840 short-term (right above the 4H MA50 as on the Feb 24/ March 01 rebounds)
-
BITCOIN repeating January’s price action within this Channel
- March 1, 2021
- Posted by: Tradingshot Articles
- Category: Cryptocurrency
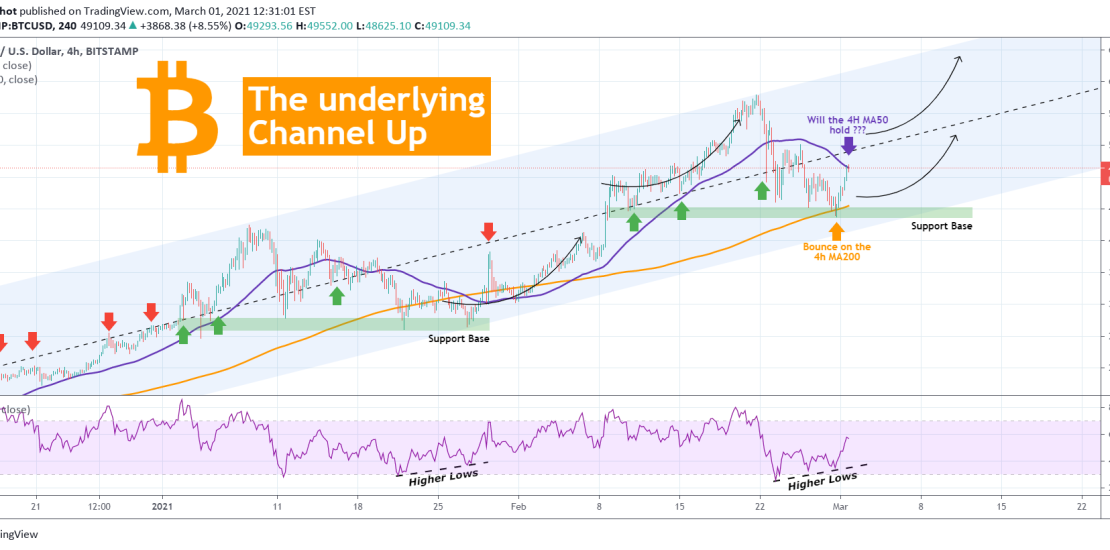
Today’s strong session on makes it necessary to take a look at the short-term price action again. * It is no coincidence that Bitcoin is on +15% gains since yesterday as it made contact with the MA200 (orange trend-line) on the 4H time-frame, which held and as a consequence initiated this very strong rebound.
- 1
- 2