

2020 January
-
BITCOIN Don’t worry about the ups and downs. Just accumulate!
- January 9, 2020
- Posted by: Tradingshot Articles
- Category: Cryptocurrency
No Comments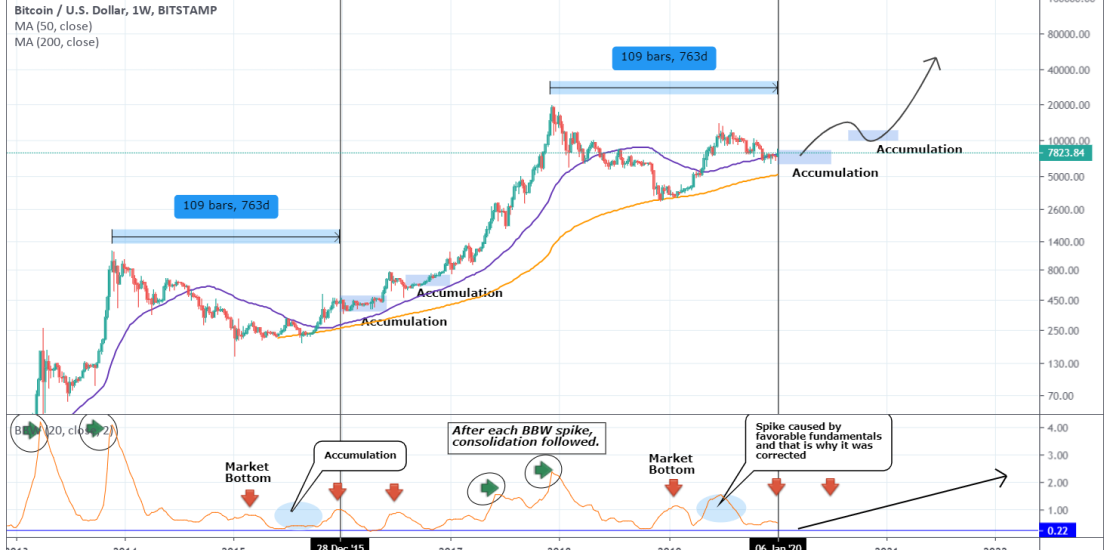
This will be a short analysis and the indicator I am using couldn’t make the picture much more clear. The Bollinger Bands Width (BBW), when Bitcoin is in a Bull Cycle, indicates periods of high volatility and accumulation. We see on the chart that at the moment the price is in on an extended
-
EURUSD Sell Signal
- January 9, 2020
- Posted by: Tradingshot Articles
- Category: Forex
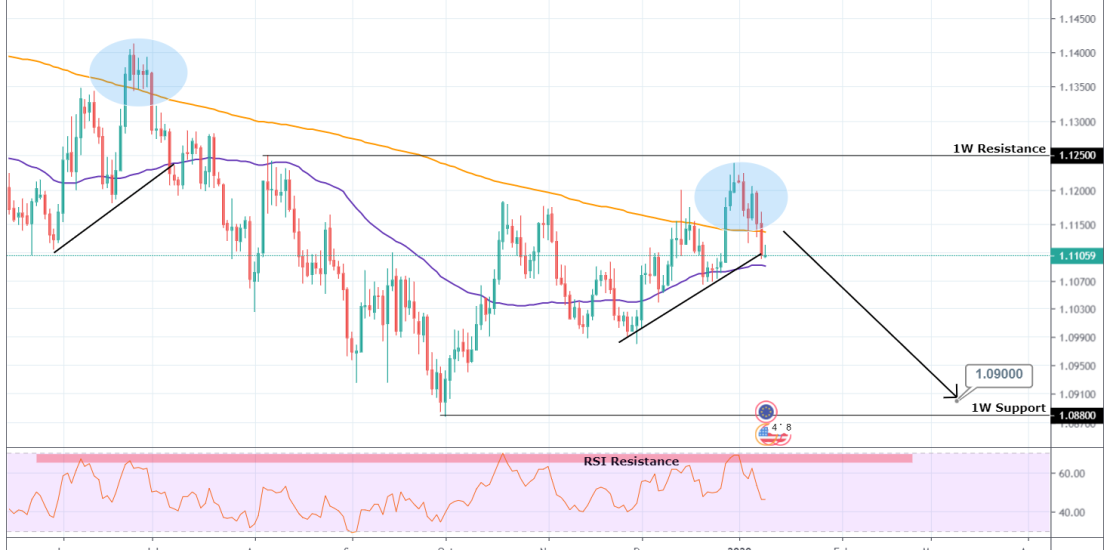
Pattern: Channel Up on 1D. Signal: Bearish as the RSI failed to break its multi month Resistance Zone and the pattern forming resembles the late June 2019 top. Target: 1.09000 (just above the 1W Support). Tradingview link: https://www.tradingview.com/chart/EURUSD/3Y3JjMuJ-EURUSD-Sell-Signal
-
XAUUSD Consolidation/ Buy Signal
- January 9, 2020
- Posted by: Tradingshot Articles
- Category: Commodities
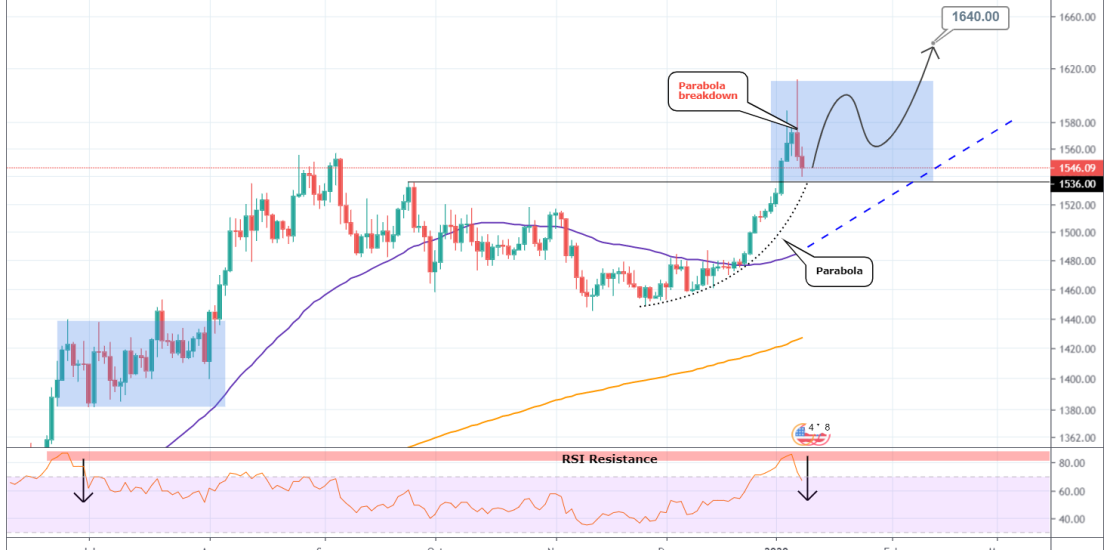
Pattern: Parabolic rise on 1D. Signal: Bullish as after the parabola broke down, the price reached the Support getting rejected on the 6-month RSI Resistance Zone. Target: 1640. Tradingview link: https://www.tradingview.com/chart/XAUUSD/MZKYkqhG-XAUUSD-Consolidation-Buy-Signal
-
AUDUSD Sell Signal
- January 8, 2020
- Posted by: Tradingshot Articles
- Category: Forex
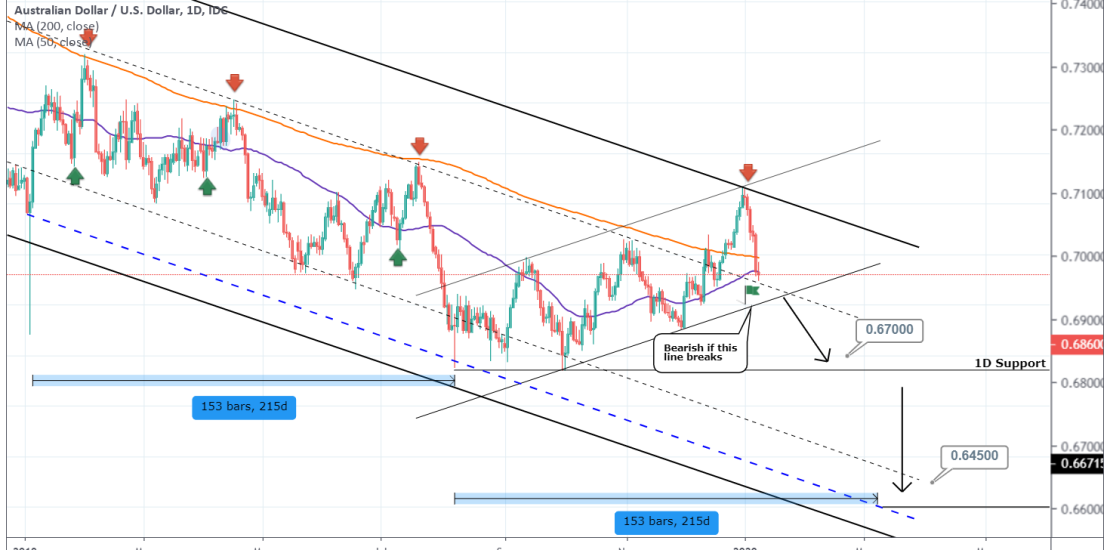
Pattern: Channel Up on 1D. Signal: Bearish if the Higher Low trend line breaks (flag mark) as the price has been already rejected on the wider 1M Channel Down (bold channel). Target: 0.6700 (just below the 1D Support). If the 1D Support breaks we may see an extension on the 1M Channel Down towards a
-
BITCOIN can test $20000. A 2020 year-end projection.
- January 4, 2020
- Posted by: Tradingshot Articles
- Category: Cryptocurrency
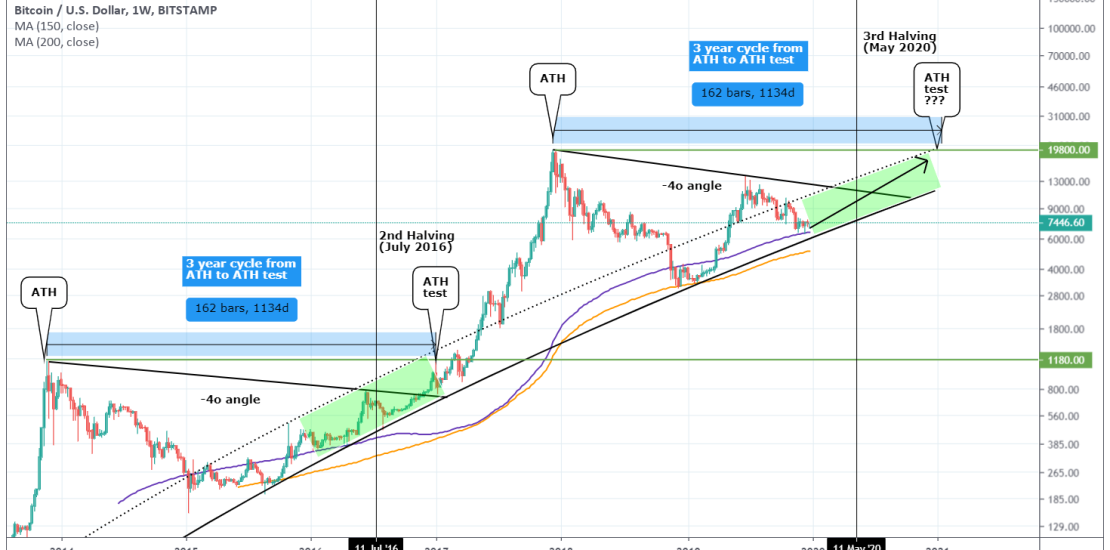
New year for Bitcoin and a whole new possibilities ahead. On this study I will share my 2020 year-end projection. There is no better place to start with than using the previous Bull Cycle, namely the start of it (2016 – 2017), as a reference point. *The time from All Time Highs (ATH) to ATH
-
XTZUSD Buy Signal
- January 3, 2020
- Posted by: Tradingshot Articles
- Category: Cryptocurrency
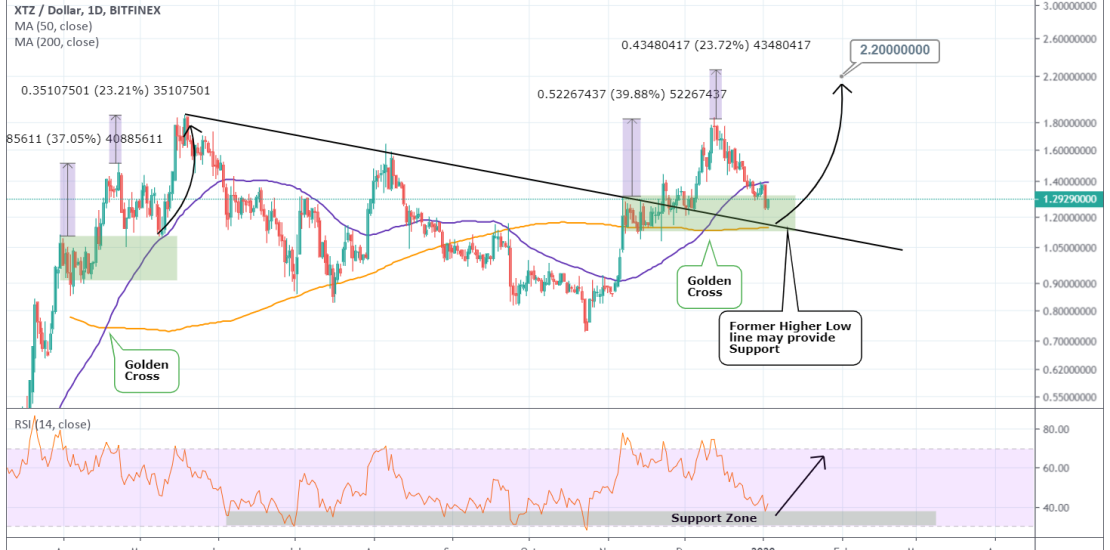
Pattern: Channel Down on 4H. Signal: Bullish as the price is approaching the former Higher Low line and the 1D MA200, both of which can provide Support. Target: 2.2000. Tradingview link: https://www.tradingview.com/chart/XTZUSD/v5N9uupS-XTZUSD-Buy-Signal
-
NZDUSD Sell Signal
- January 3, 2020
- Posted by: Tradingshot Articles
- Category: Forex
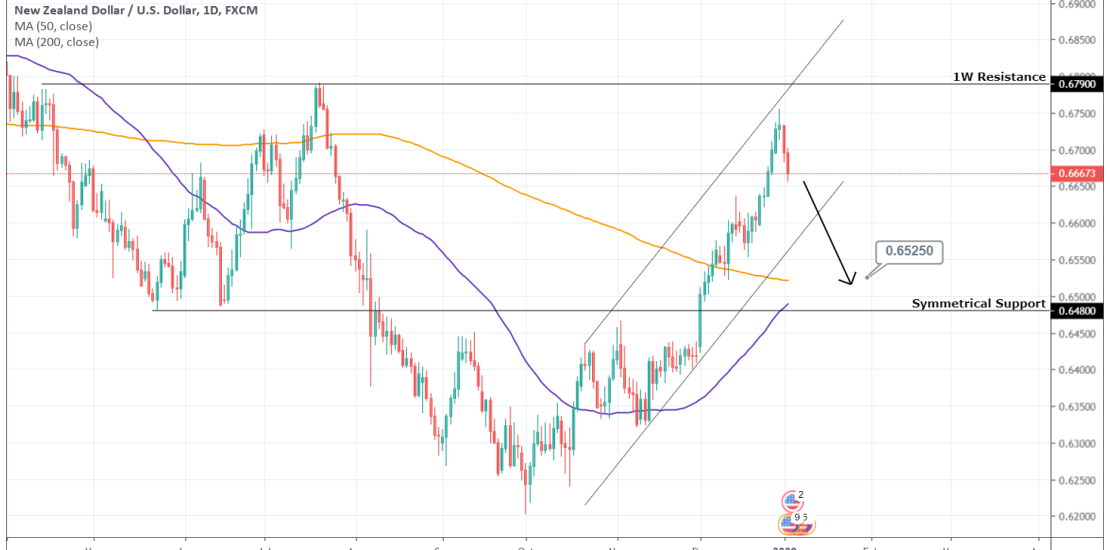
Pattern: Channel Up on 1D. Signal: Bearish as the price was rejected near the 1W Resistance. Target: 0.6525 (above the Symmetrical Support). Tradingview link: https://www.tradingview.com/chart/NZDUSD/qOaTXSSo-NZDUSD-Sell-Signal
- 1
- 2