

2019
-
BTCUSD Where symmetry meets the resistance
- March 19, 2019
- Posted by: Tradingshot Articles
- Category: Uncategorized
No Comments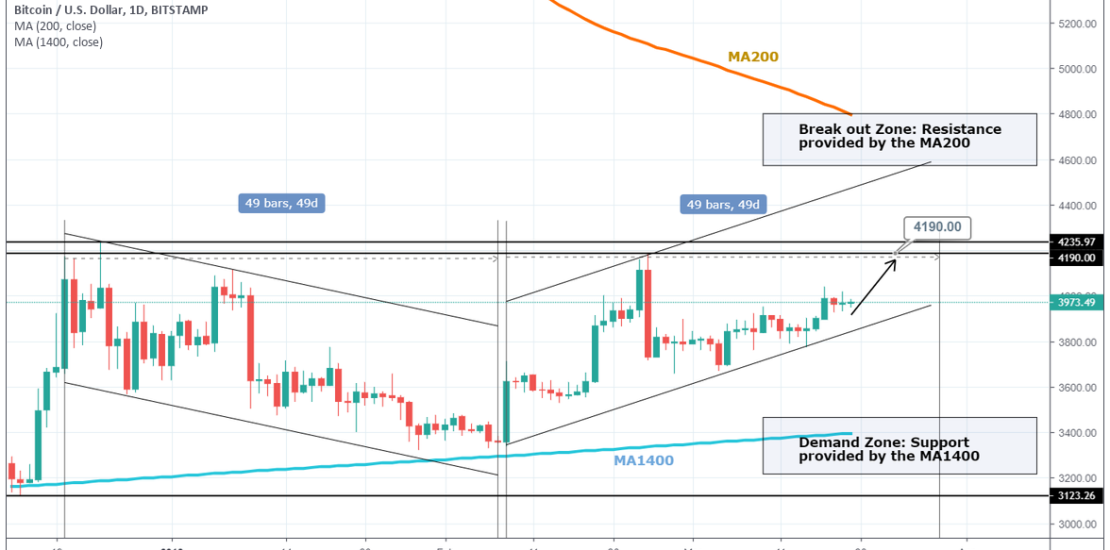
The symmetrical 1D Channel Up is close to hitting the 4190 target but more significantly to meet the MA200 that has been holding the bear market in place. This is a very important benchmark for Bitcoin as any break above this level technically signals the end of the bear market. High significance 2 – 3
-
GBPUSD Sell Signal
- March 18, 2019
- Posted by: Tradingshot Articles
- Category: Uncategorized
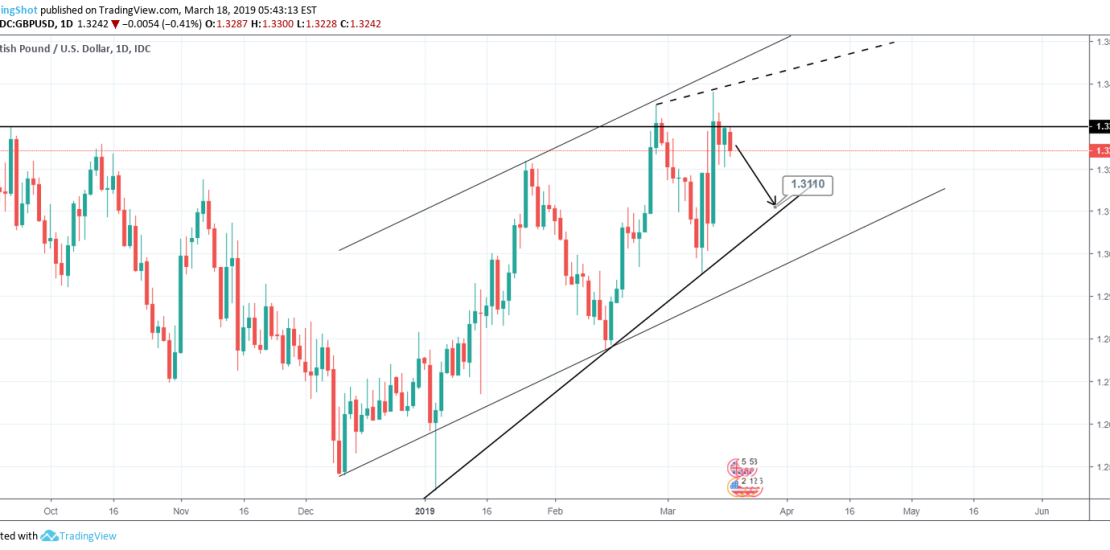
Pattern: 1D Channel Up. Signal: Bearish after the pattern made a Higher High. Target: 1.3110 (the inside supporting trend line of the Channel Up). The long term Brexit effect on GBPUSD: Tradingview link: https://www.tradingview.com/chart/GBPUSD/FnaNXcbZ-GBPUSD-Sell-Signal/
-
DOW JONES 50% correction or a new norm?
- March 17, 2019
- Posted by: Tradingshot Articles
- Category: Stock Indices
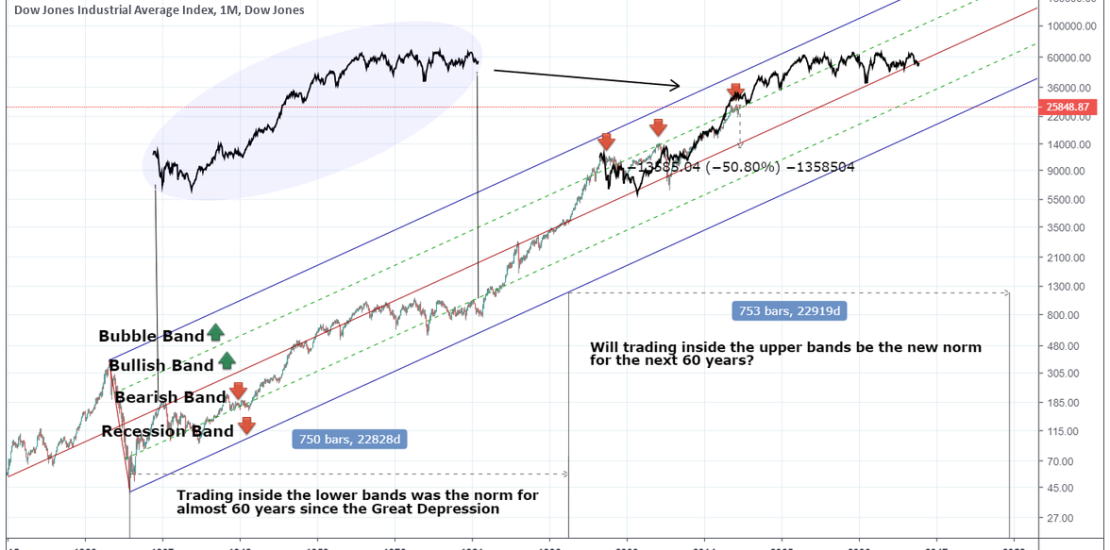
The question on everyone’s mind is that: “Are stocks overvalued right now or not?”, “Is a major crash coming or we’ve seen the bottom and we’re going for new all time highs?”. This is a hard question to ask. I try to approach this matter using the Great Depression as my basis point. Using the
-
Is the Altcoin market about to explode?
- March 16, 2019
- Posted by: Tradingshot Articles
- Category: Cryptocurrency
Those who are into fractals will love this. The RSI on the 1W Altcoin Market Cap (ex BTC) is posting a similar sequence to the November 2014 – March 2015 price action. The small dip that followed gave way to the start of the bull market on Alts. Is this an early buy signal on
-
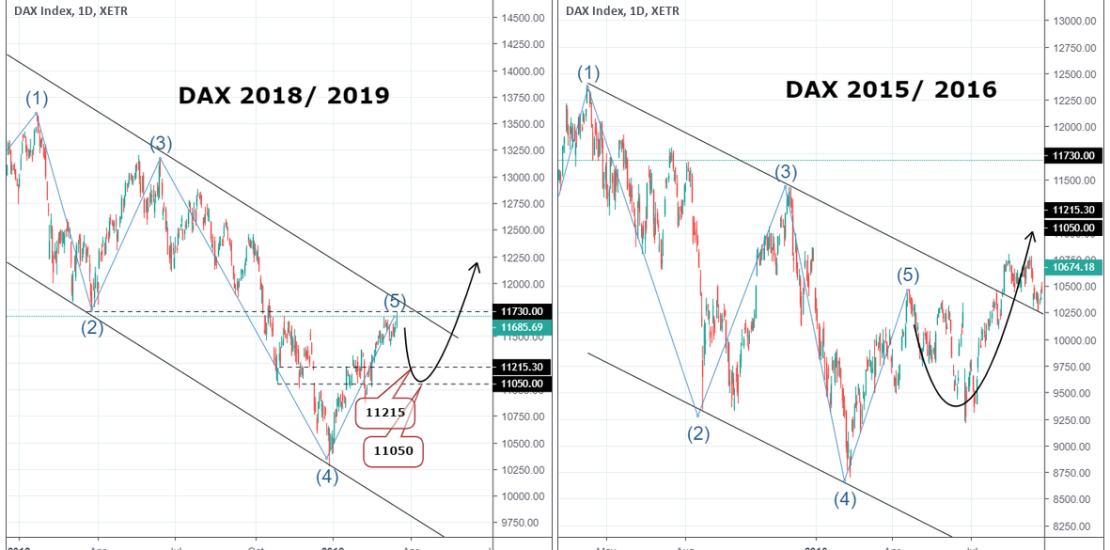
DAX Big Sell Signal
- March 15, 2019
- Posted by: Tradingshot Articles
- Category: Uncategorized

Pattern: Channel Down on 1W. Signal: Bearish since the price is near the pattern’s Lower High. Target: TP1 11215, TP2 11050. *Note: The same pattern took place in 2015/ 2016. After the 5th wave on the Lower High the index pulled back to its 0.5 Fibonacci and then broke the Channel upwards. Tradingview link: https://www.tradingview.com/chart/DAX/CQbswQgi-DAX-Big-Sell-Signal/
-
Bitcoin’s Fibonacci Channel and the Band Shift to 100k
- March 11, 2019
- Posted by: Tradingshot Articles
- Category: Cryptocurrency
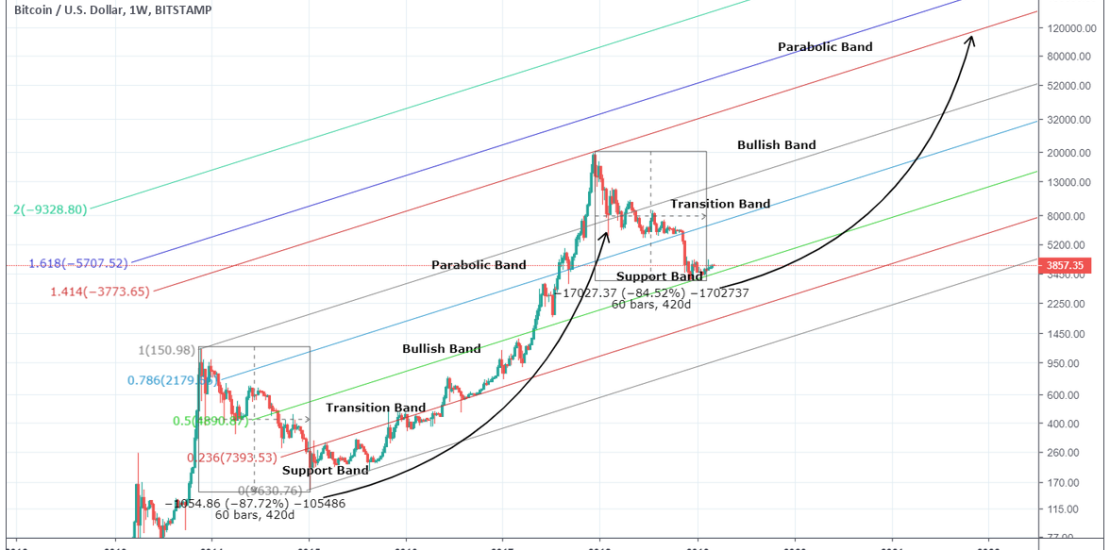
BTC’s last bull market can be adequately broken down using the Fibonacci Channel as a Phase Marker. During 2015 the 0 – 0.236 Fibonacci band was used as a Support. Similarly in 2016 the 0.236 – 0.5 was the Transition Phase from the Bottom to the start of the new Bull Market, leading to then
-
MANAUSD Buy Signal
- March 8, 2019
- Posted by: Tradingshot Articles
- Category: Uncategorized
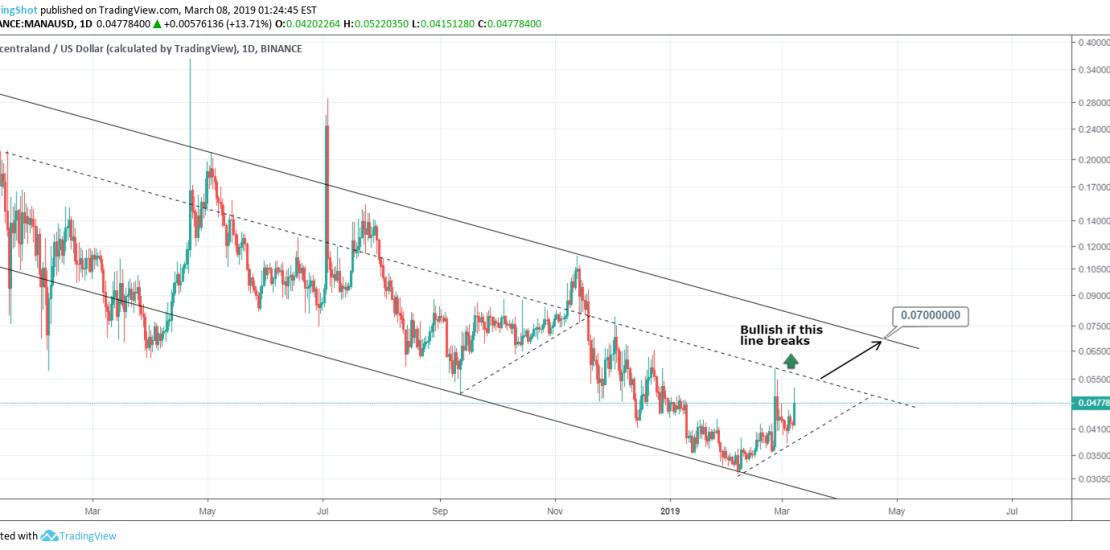
Pattern: Channel Down on 1W. Signals: Bullish if the inner Lower High line breaks. Target: 0.07000 (outer Lower High). Tradingview link: https://www.tradingview.com/chart/MANAUSD/Q3yWH21C-MANAUSD-Buy-Signal/
-
DOLLAR INDEX Sell Signals
- March 7, 2019
- Posted by: Tradingshot Articles
- Category: Uncategorized
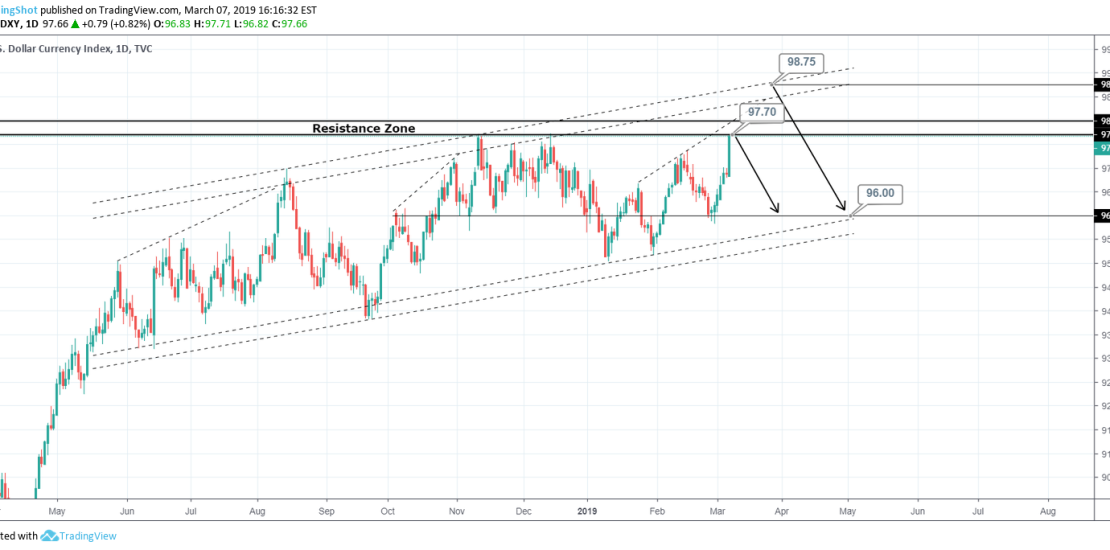
Pattern: Channel Up on 1W. Signal: Bearish on two marks. 1st the 97.70 Resistance. 2nd the 98.75 estimated Higher High. Target: 96.00. Tradingview link: https://www.tradingview.com/chart/DXY/Kk5Liaq5-DOLLAR-INDEX-Sell-Signals/
-
DAX Sell Signal
- March 6, 2019
- Posted by: Tradingshot Articles
- Category: Uncategorized
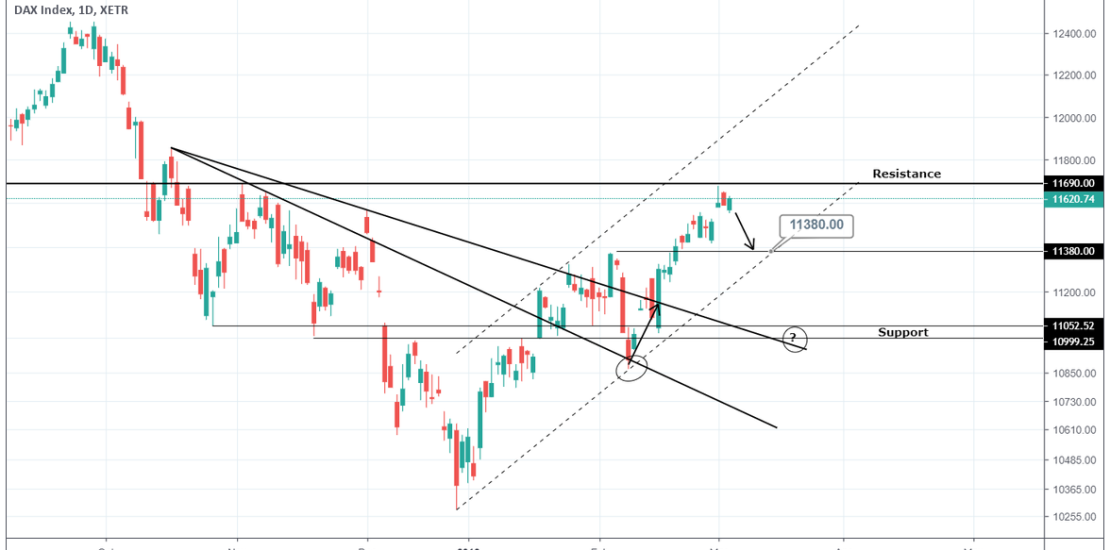
Pattern: 1D Channel Up. Signal: Bearish as the price has been rejected on the 1W Resistance. Target: 11380 (the Channel’s Higher Low). Tradingview link: https://www.tradingview.com/chart/DAX/HXf5883J-DAX-Sell-Signal/
-
PALLADIUM Buy Signal
- March 5, 2019
- Posted by: Tradingshot Articles
- Category: Uncategorized
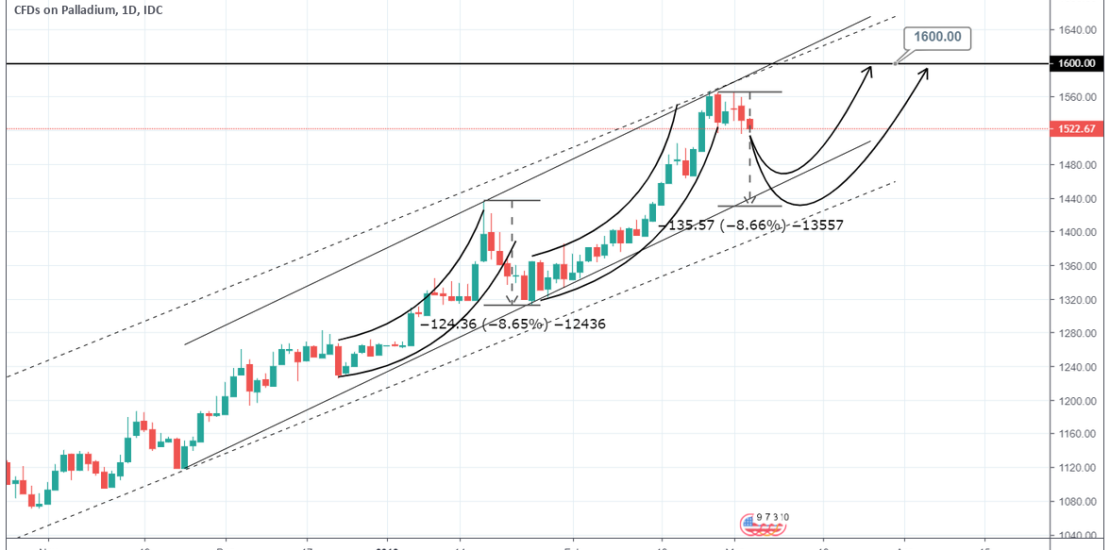
Pattern: Channel Up on 1D. Signal: Bullish once 1) the price test the Higher Low and 2) completes a -8.65% pull back. Target: 1600. Tradingview link: https://www.tradingview.com/chart/XPDUSD/GlODNGCa-PALLADIUM-Buy-Signal/