

- June 3, 2019
- Posted by: Tradingshot Articles
- Category: Uncategorized
No Comments
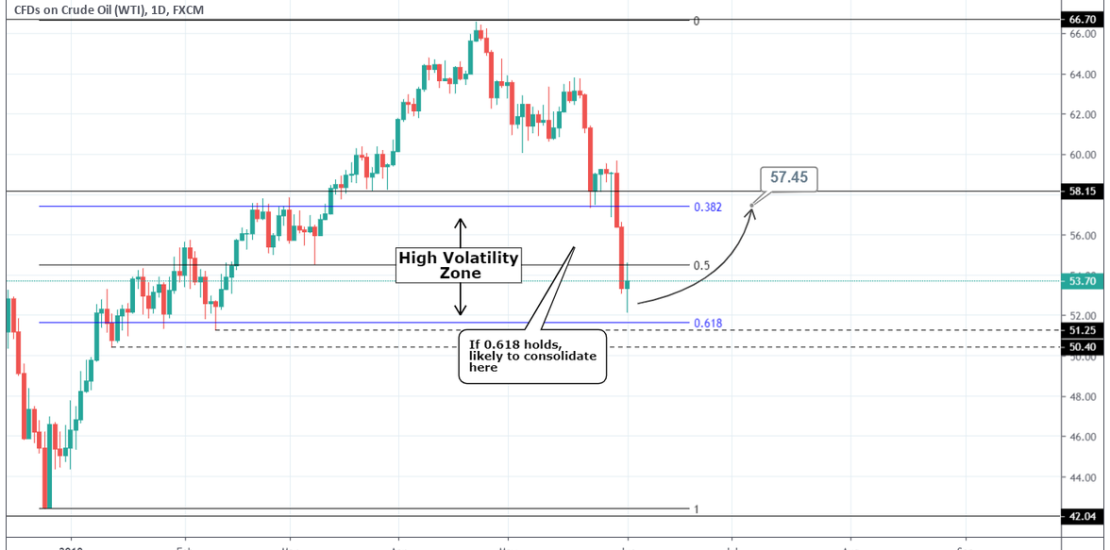
Pattern: Resistance/ Support trading based on Fibonacci levels.
Signal: Bullish as the price is near the 0.618 Fibonacci retracement level and the 50.40 – 51.25 1W Support Zone.
Target: 57.45 (the 0.382 Fibonacci level which may act as a Resistance).
Tradingview link:
https://www.tradingview.com/chart/USOIL/a4LSIRUm-WTI-OIL-Buy-Signal