

- September 9, 2019
- Posted by: Tradingshot Articles
- Category: Cryptocurrency
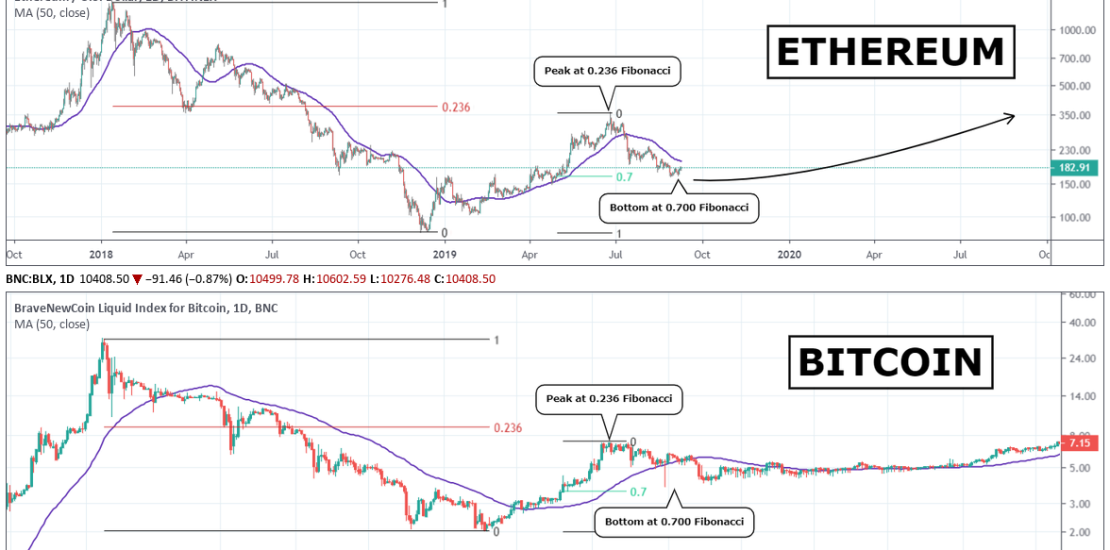
Well the title says it all, but can it really be? Ethereum currently following Bitcoin’s first cycle (2011/ 2012)?
This is a simplistic yet interesting comparison of the two cycles. After BTC’s 2011 bottom, the price peaked near the 0.236 Fibonacci retracement. Then it pulled back again but found support on the 0.700 Fibonacci retracement level, only to trade sideways for around 4 months before picking up the new Bull Cycle again. ETH’s current candle action is following a similar pattern as after the 2018 bottom, it peaked near the 0.236 level only to pull back again currently on the 0.700 retracement zone.
Can this mean that ETHUSD found a bottom and is about to start a lengthy consolidation before picking up the Bull Cycle rally? Let me know what you think in the comments section.
Tradingview link:
https://www.tradingview.com/chart/ETHUSD/hFwCXtg6-ETHEREUM-following-BITCOIN-s-first-cycle