

- November 18, 2021
- Posted by: Tradingshot Articles
- Category: Commodities
It’s been a while since I updated my Gold thesis. My last post was a short-term bullish trade on 4H:

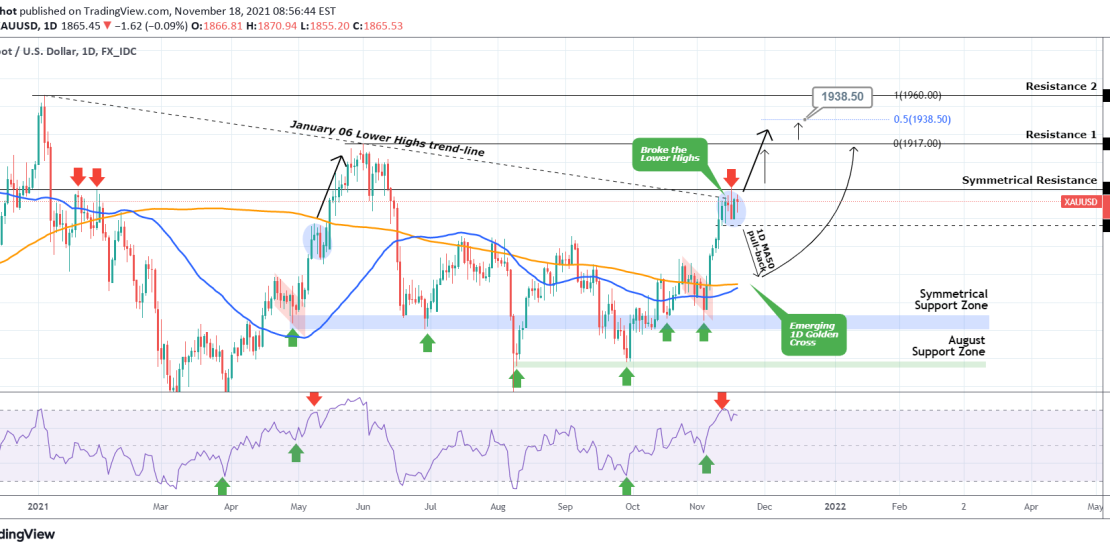
That target has been achieved and now we have to switch back to 1D for a more effective evaluation of the current trend. Obviously that is bullish as not only has Gold (XAUUSD) been rising non-stop since the September 29 low but more importantly at the start of the current week it broke two major Resistance levels: a) the Lower Highs trend-line that started on the January 06 High and the 1876 Symmetrical Resistance (but only marginally, the 1D candle closed back in on the same day and hasn’t broken back above it again).
It is obvious that in order for the bullish trend to be extended, the price has to close a 1D candle above the 1876 Symmetrical Resistance. If it does, the natural targets would be first 1917 (Resistance 1 from the June 01 High) and if a 1D candle closes above it, then 1938.50 (middle of the two Resistance levels: 1960 and 1917). As you see the October – November rally has been mimicking that of April – May (both pattern and RSI wise).
However, if a 1D candle is closed below the 1843.50 short-term Resistance, this plan may have to be abandoned as the price may seek its long-term technical Support of the 1D MA50 (blue trend-line) and then, with the 1D Golden Cross emerging, resume the bullish trend. Much of this of course depends on key upcoming macro-economic events such as the U.S. GDP next week, so stay alert.
Tradingview link: