

- December 22, 2020
- Posted by: Tradingshot Articles
- Category: Uncategorized
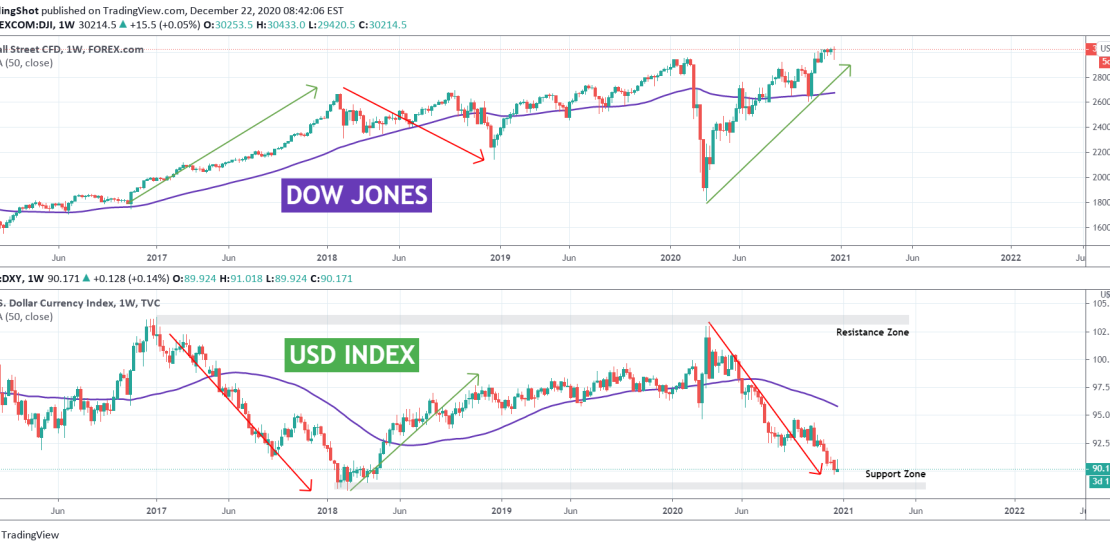
This is a simple yet very informative study showing a comparison of Dow Jones against DXY (U.S. Dollar Index).
Since early 2015 the DXY has been ranging (wide range but still range) and especially after 2017 it established a clear Resistance (103.800 – 103.000) and Support (88.200 – 88.900) Zone. Every time it hit the Resistance and got rejected (Jan 2017, March 2020), Dow Jones started rising aggressively. Similarly when DXY hit the Support Zone (Feb 2018), Dow Jones (though volatile) made a new Low.
The DXY is currently very close to that Support Zone. Will another rebound here kick-start selling on the stock market? That chart certainly shows that. However we have to consider the (much longer) Cycles of DXY on a decade span (I posted that chart earlier today), which suggest that there are increased chances of breaking this Support.
Which scenario do you think will prevail? Will DXY hold this Support and cause selling on stocks or the opposite? Feel free to share your work and let me know in the comments section!
Please like, subscribe and share your ideas and charts with the community!
——————————————————————————————————–
!! Donations via TradingView coins also help me a great deal at posting more free trading content and signals here !!
🎉 👍 Shout-out to TradingShot’s 💰 top TradingView Coin donor 💰 this week ==> OCDJ
——————————————————————————————————–
Tradingview link: